Effective presentation and communication of business analytics play a critical role in influencing decision-making, securing stakeholder buy-in, and driving strategic actions.
From preparing concise executive summaries to crafting compelling visual stories, presenting to diverse audiences, and managing questions with transparency, professionals must master a nuanced blend of clarity, engagement, and authenticity.
Executive Summary Preparation with Key Findings
Executive summary preparation involves starting presentations with a clear and concise overview of key insights, recommendations, and their business implications.
The main message should be highlighted succinctly to capture attention and provide context, respecting executives’ limited time.
Using bullet points or brief paragraphs helps structure the summary logically, while including quantified business impacts and strategic relevance emphasizes value.
A well-prepared executive summary sets the stage for detailed discussions and directs stakeholder focus effectively.
Visual Storytelling through Dashboards and Charts
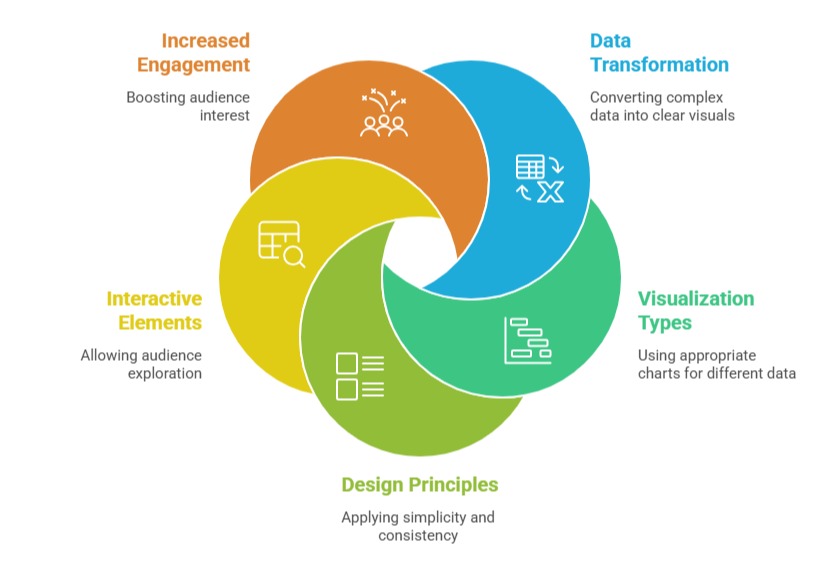
It involves transforming complex data into clear, actionable visual narratives. Selecting appropriate visualization types—such as bar charts for comparisons, line charts for trends, or heatmaps for intensity—enhances understanding.
Applying design principles like simplicity, consistency, and emphasis ensures key insights stand out, while interactive elements such as slicers or filters allow audiences to explore the data.
Effective visual storytelling promotes better comprehension and increases engagement with the information presented.
Presenting to Diverse Stakeholder Audiences
It requires tailoring content to match the knowledge, interests, and priorities of groups such as executives, technical teams, or clients. Communication should be clear and jargon-free, emphasizing the “why” and “so what” rather than technical details of “how.”
Presentations should balance summary-level insights with the option to explore deeper details upon request.
Actively engaging stakeholders through Q&A, polls, or discussion prompts enhances interaction and understanding. Customized delivery ensures maximum relevance and impact for each audience.
Handling Questions and Communicating Analytical Limitations
It involves anticipating potential inquiries and preparing evidence-based responses supported by data. It is important to openly acknowledge uncertainties, assumptions, and limitations to build credibility and trust.
Analysts should clearly distinguish between data-driven insights and exploratory findings or hypotheses, and when uncertain, commit to conducting follow-up research rather than providing speculative answers.
Transparent communication strengthens integrity and reinforces stakeholder confidence in the analysis.

Class Sessions
Sales Campaign

We have a sales campaign on our promoted courses and products. You can purchase 1 products at a discounted price up to 15% discount.