Data organization and transformation are essential steps for preparing raw data into a structured, analyzable form. Proper structuring optimizes the usability of data, supports accurate analysis, and enhances decision-making.
This process includes arranging data in tabular or dimensional formats, creating calculated fields and derived variables for enriched insights, applying normalization and standardization techniques to ensure consistency, and converting raw datasets into formats suitable for analytical tools and models.
Structuring Data for Analytical Purposes: Tabular and Dimensional Structures
Data can be organized in different structures depending on the analysis goals:
1. Tabular Data: The most common format, where data is stored in rows and columns, akin to spreadsheets. Each row represents an observation or record, and each column represents an attribute or variable.
2. Dimensional Structures: Used primarily in data warehousing, this approach organizes data into fact and dimension tables.
Fact tables record measurable events (e.g., sales transactions), while dimension tables describe the context (e.g., customers, time, products). This schema supports efficient querying and aggregation in business intelligence.
Choosing the right structure enhances data accessibility and analytical efficiency.
Creating Calculated Fields and Derived Variables
Analytics often require new variables derived from existing data to capture more meaningful insights:
Calculated Fields: Values computed using mathematical formulas or logical conditions based on existing columns. For instance, profit margin = (Revenue - Cost) / Revenue.
Derived Variables: Constructed by aggregating or transforming data, such as creating age groups from birthdates or categorizing customers by purchase frequency.
These enriched fields help reveal trends and relationships that raw data alone might not show.
Data Normalization and Standardization Techniques
To ensure comparability and improve model performance, data is often transformed through normalization or standardization:
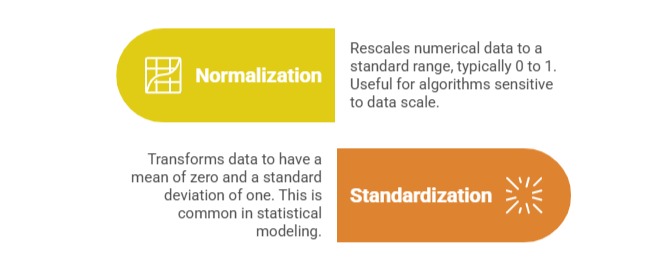
Both techniques reduce bias caused by varying units or large value ranges, enhancing the reliability of analytics.
Transforming Raw Data into Analytical Datasets
The final step involves converting disparate, unstructured inputs into clean, formatted datasets ready for analysis:
1. Apply conversion routines to unify formats (dates, currencies, codes).
2. Clean and filter irrelevant or erroneous records.
3. Aggregate granular data to summary levels if needed.
4. Create datasets structured to meet the analytic methodology, whether for exploratory data analysis, predictive modeling, or reporting.
This transformation process is iterative and foundational to producing accurate, actionable analytics.
