Storytelling with data transforms complex data into compelling narratives that engage stakeholders, clarify insights, and drive informed actions.
Effective data storytelling combines a clear narrative structure with purposeful visuals, ensuring that data insights resonate with the audience and inspire decision-making.
The Narrative Structure: Problem, Insight, Action Framework
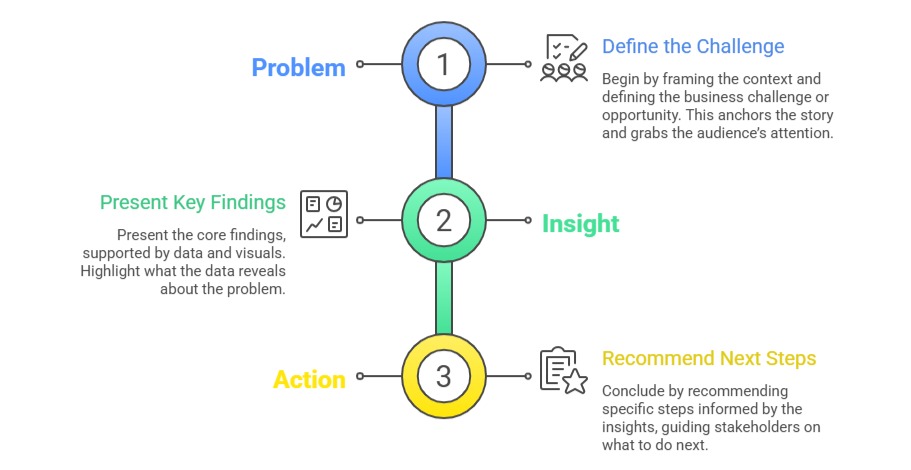
This logical flow ensures that stories are clear, purposeful, and action-oriented, not just a display of numbers.
Starting with Conclusions: Knowing Your Message Before Creating Visuals
Starting with conclusions is a key principle of effective data storytelling, requiring you to identify the main message or takeaway before creating any visuals.
This top-down communication style presents the primary conclusion first, followed by the supporting evidence, aligning with business audiences’ preference for clear and concise recommendations.
It prevents overwhelming viewers with unnecessary details before they grasp the significance of the insight. Beginning with a strong, clear message enhances engagement and keeps the focus on the most relevant data.
Progressive Insight Revelation: Sequencing Information for Maximum Impact
It involves presenting information in a layered, sequenced manner to maximize clarity and impact. The narrative begins with high-level overviews and gradually moves into more detailed data and supporting points.
Visuals and deliberate pacing help maintain interest and improve comprehension throughout the story. By chunking information and guiding viewers through a structured arc, this approach prevents overload and supports deeper understanding.
Connecting Data to Business Outcomes and Human Implications
It involves clearly linking insights to their effects on organizational goals, strategies, or customer experiences. Highlighting real-world consequences, benefits, or risks makes the data more meaningful and actionable.
Personalizing the narrative with human elements—such as customer quotes, case studies, or employee testimonials—grounds abstract numbers in relatable contexts.
This approach enhances relevance and urgency, helping stakeholders understand why the insights matter and motivating them to take informed action.

Class Sessions
Sales Campaign

We have a sales campaign on our promoted courses and products. You can purchase 1 products at a discounted price up to 15% discount.