Operational analytics provides businesses with real-time insights and data-driven decision-making capabilities focused on improving daily operations.
By defining key performance indicators (KPIs) and metrics, identifying bottlenecks, creating dynamic dashboards, and applying continuous improvement methodologies, organizations optimize efficiency, reduce costs, and enhance customer satisfaction.
Defining Operational Metrics and KPIs for Process Monitoring
Operational analytics begins with selecting relevant metrics that reflect operational performance and strategic goals:
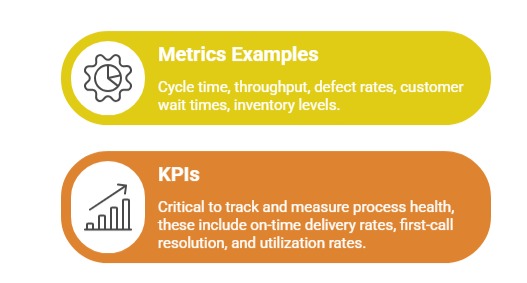
Metrics should be SMART (Specific, Measurable, Achievable, Relevant, Timely) and aligned with business objectives.
Continuous tracking ensures early detection of deviations, enabling corrective measures.
Identifying Operational Bottlenecks and Inefficiencies Through Data Analysis
It involves examining process data to pinpoint areas where delays, quality issues, or resource constraints arise. Techniques such as process mining, root cause analysis, and flow mapping help uncover these inefficiencies.
Common indicators of bottlenecks include increased wait times, backlogs, or frequent errors.
By using a data-driven approach, organizations can prioritize interventions that have the greatest operational impact, enhancing throughput and improving customer outcomes.
Creating Dashboards for Real-Time Operational Monitoring
Consolidating key performance indicators (KPIs) and metrics into visual, live displays accessible across teams.
Charts, gauges, and traffic-light indicators provide at-a-glance status assessments, while interactive features allow drill-down into detailed data for granular analysis.
Tools such as Tableau, Power BI, and specialized operational analytics platforms support these capabilities. By leveraging real-time data feeds, organizations can make proactive decisions and respond quickly to operational events.
Continuous Improvement Methodologies Using Analytical Insights
Applying iterative approaches such as Lean, Six Sigma, or Kaizen guided by data.
Performance metrics are used to establish baselines, measure progress, and refine processes over time. Feedback loops, including monitoring outcomes and gathering stakeholder input, inform ongoing adjustments.
By leveraging data, organizations can implement targeted improvements instead of relying on reactive measures or guesswork, driving sustained operational excellence.

Class Sessions
Sales Campaign

We have a sales campaign on our promoted courses and products. You can purchase 1 products at a discounted price up to 15% discount.