Scenario analysis and optimization are critical tools in business analytics for evaluating how changes in variables affect outcomes, optimizing decision-making, and preparing for diverse future possibilities.
These techniques enable organizations to make informed, data-backed decisions by systematically exploring uncertainties, allocating resources efficiently, and testing alternative strategies.
Excel offers powerful built-in features—Sensitivity Analysis, Solver, Goal Seek, and Scenario Manager—that empower professionals to perform these advanced analyses seamlessly.
Sensitivity Analysis: Understanding Impact of Variable Changes on Outcomes
Sensitivity analysis examines how variations in input variables influence a model’s output. It helps identify which factors have the most significant effect on results.
Business Use: Companies use sensitivity analysis to assess risks, for example, by determining how fluctuations in raw material costs impact profit margins or how changes in interest rates affect loan repayment schedules.
Techniques: Sensitivity can be conducted through one-way or multi-way analysis, changing one or multiple variables systematically.
Benefits: Helps prioritize key drivers and anticipate impacts of changes, supporting robust risk management.
Solver Tool: Optimization for Resource Allocation and Cost Minimization
Solver is an Excel add-in that finds optimal values for decision variables to maximize or minimize a target (objective function) subject to constraints.
Applications: Widely used for budgeting, production planning, supply chain optimization, and scheduling tasks.
How it Works: Users define an objective (e.g., maximize profit, minimize costs), specify variables (e.g., production quantities), and set constraints (e.g., available resources, demand levels).
Example: A factory uses Solver to determine the number of units for each product that maximizes profit without exceeding labor and material limitations.
Benefits: Automates complex optimization, enabling efficient resource use and better financial performance.
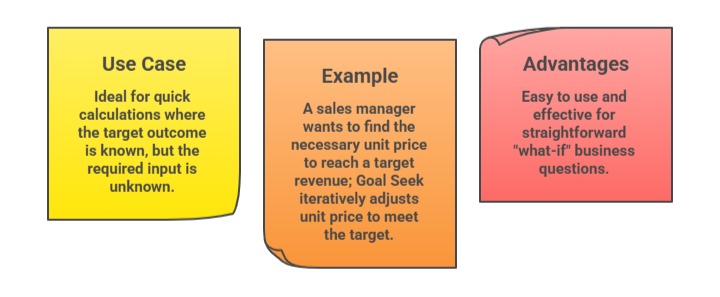
Goal Seek: Working Backwards from Desired Outcomes to Determine Inputs
Goal Seek is a simple Excel tool that adjusts one input value to achieve a desired result in a formula.
Scenario Manager: Evaluating Multiple Business Alternatives
Scenario Manager allows users to create and compare different sets of input values (scenarios) within Excel workbooks.
Purpose: Facilitates the analysis of various "what-if" scenarios, such as best case, worst case, and most likely business forecasts.
Process: Users define alternative scenarios by changing inputs like costs, sales volumes, or market conditions and then switch between scenarios to compare outcomes.
Example: A financial analyst models revenue projections under different economic conditions using Scenario Manager.
Benefits: Visualizes potential impacts of business decisions helping companies prepare and plan strategically.
