Descriptive statistics are essential tools used to summarize and describe the main features of a dataset. They provide a clear overview of the data by quantifying its central tendency, spread, and distribution shape.
These measures help business professionals interpret data efficiently and make informed decisions by understanding basic patterns, variability, and anomalies.
Measures of Central Tendency: Mean, Median, Mode
Central tendency measures identify a typical or central value around which data points cluster.
Mean: The arithmetic average of all data points. It is sensitive to extreme values (outliers) and best suited for symmetrical distributions.
Median: The middle value when data is ordered. It is robust to outliers and preferred for skewed distributions.
Mode: The most frequently occurring value, useful for categorical data and detecting common occurrences.
In business, the mean helps calculate average sales, the median might represent typical customer income, and mode identifies the most popular product.
Measures of Dispersion: Standard Deviation, Variance, Range, and Quartiles
Dispersion measures provide insights into data variability or spread from the central value.
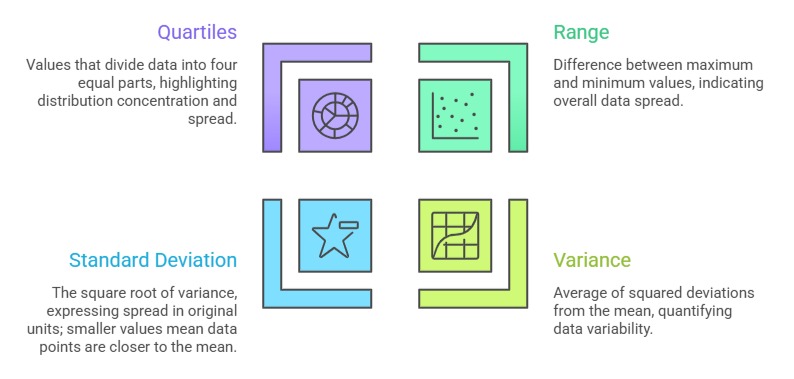
These measures help businesses assess consistency, risk, or variability—such as variability in sales or product quality.
Distribution Analysis: Data Spread and Pattern Recognition
Understanding the distribution of data assists in recognizing underlying patterns, skewness, or anomalies. Tools like histograms and box plots visualize how data points are spread across ranges and clusters.
Analyzing distribution helps organizations detect seasonal trends, sales spikes, or process variations critical for planning and forecasting.
Skewness and Kurtosis: Shape of Distributions and Outlier Implications
Skewness: Measures asymmetry of the data distribution.
1. Positive skewness: Tail extends to the right, indicating potential extreme high values.
2. Negative skewness: Tail extends left, pointing to extreme low values.
Kurtosis: Describes the "tailedness" or peakedness of data distribution.
1. High kurtosis means more outliers and heavy tails, increasing risk of unusual data points.
2. Low kurtosis indicates lighter tails and fewer outliers.
Understanding these shapes informs risk assessment and guides appropriate statistical modeling.

Class Sessions
Sales Campaign

We have a sales campaign on our promoted courses and products. You can purchase 1 products at a discounted price up to 15% discount.