Data retrieval and query writing are fundamental skills for extracting meaningful insights from databases.
Structured Query Language (SQL) is the standard language for querying relational databases, allowing users to select, filter, join, and summarize data efficiently.
Mastering essential SQL commands, understanding how to combine multiple data tables, and writing complex queries with subqueries are crucial for addressing varied business questions.
Additionally, aggregate functions enable summarization of large datasets, facilitating analysis and reporting.
Essential SQL Statements for Data Selection and Filtering
SQL commands allow users to specify exactly what data they want from a database. The most common statements are:
SELECT: Specifies which columns to retrieve.
Example: SELECT EmployeeID, Name FROM Employees;
WHERE: Filters rows based on a condition.
Example: SELECT * FROM Orders WHERE OrderDate > '2025-01-01';
ORDER BY: Sorts the output in ascending or descending order.
Example: SELECT Name FROM Customers ORDER BY Name ASC;
By combining these clauses, users can efficiently narrow down datasets to relevant records for analysis.
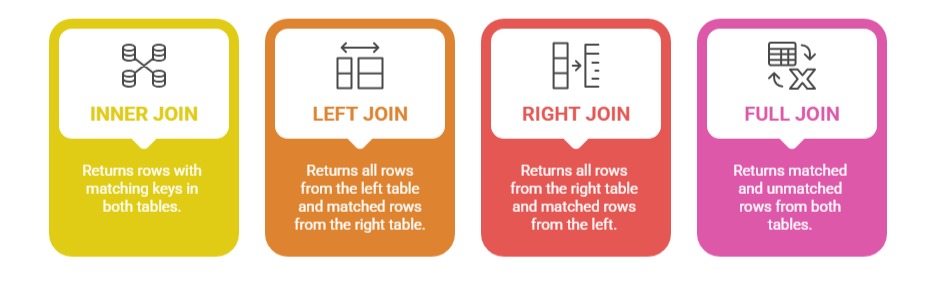
Joining Multiple Tables to Combine Datasets
Business data is often stored across multiple related tables. SQL JOIN operations allow combining these tables to create comprehensive views:
Example:
SELECT Employees.Name, Departments.DepartmentName

FROM Employees

INNER JOIN Departments ON Employees.DepartmentID = Departments.DepartmentID;
This query retrieves employee names along with their department names by linking two tables on DepartmentID.
Writing Complex Queries and Subqueries for Business Questions
Complex queries incorporate multiple operations and nested queries, called subqueries, to solve sophisticated problems.
1. Subqueries are queries within queries, used to filter or calculate intermediate results.
2. Can be correlated (dependent on outer query) or independent.
3. Useful in scenarios like: finding employees with salaries above their department average, or selecting customers who placed orders in the last month.
Example of a subquery filtering employees with salary above the department average:
SELECT Name, Salary

FROM Employees e

WHERE Salary > (SELECT AVG(Salary) FROM Employees WHERE DepartmentID = e.DepartmentID);
Incorporating subqueries improves query flexibility and power.
Aggregate Functions for Data Summarization
Aggregate functions perform calculations on sets of rows to provide summarized information:
SUM(): Total sum of a numeric column.
COUNT(): Number of rows matching criteria.
AVG(): Average value.
MIN(): Minimum value.
MAX(): Maximum value.
These functions are often used with GROUP BY to aggregate data by categories.
Example:
SELECT DepartmentID, COUNT(EmployeeID) AS NumberOfEmployees, AVG(Salary) AS AverageSalary

FROM Employees

GROUP BY DepartmentID;
This query reports how many employees and the average salary in each department.

Class Sessions
Sales Campaign

We have a sales campaign on our promoted courses and products. You can purchase 1 products at a discounted price up to 15% discount.