An effective end-to-end analytics workflow transforms raw data into actionable business insights through a structured series of stages.
This process begins with understanding business needs and engaging stakeholders, proceeds through rigorous data preparation and analysis, and culminates in visualization and insight-driven decision-making.
Business Understanding and Stakeholder Engagement
Business understanding and stakeholder engagement involve defining clear objectives and problem statements that align with organizational goals.
Engaging stakeholders—including business leaders, domain experts, and end-users—helps capture requirements and expectations accurately.
Clarifying the project scope, constraints, and success criteria early ensures analytical efforts are focused and efficient. Effective communication throughout the process builds consensus and secures commitment for data-driven initiatives.
Data Collection, Preparation, and Exploratory Analysis
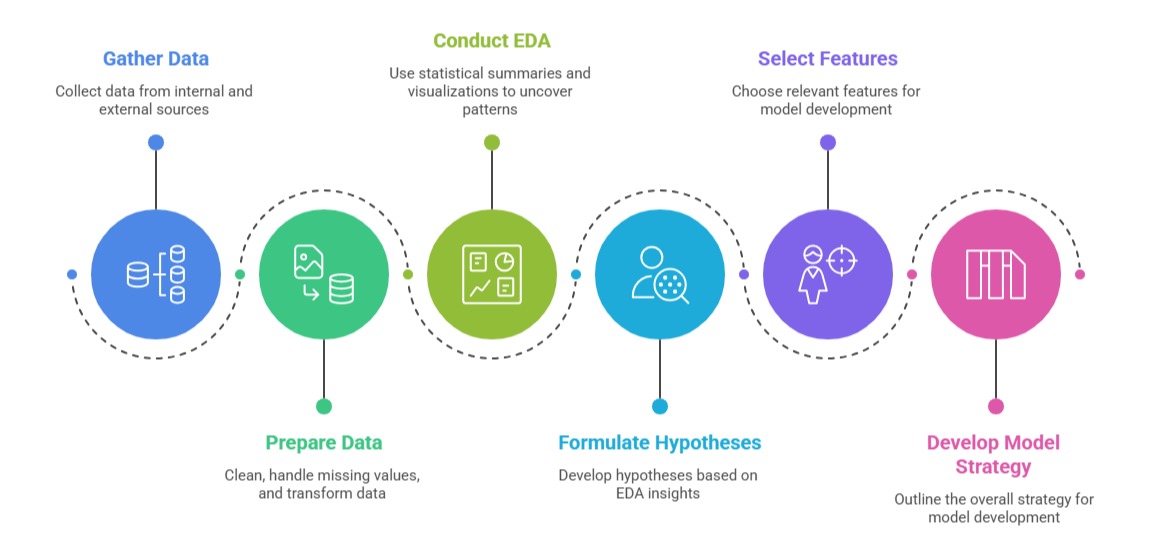
Data collection, preparation, and exploratory analysis begin with gathering relevant data from internal systems, external sources, and third-party providers.
The data is then prepared through cleaning, handling missing values, detecting outliers, and performing transformations to ensure quality and consistency.
Exploratory data analysis (EDA) is conducted using statistical summaries and visualizations, such as scatter plots and histograms, to uncover patterns and anomalies. Insights from EDA inform feature selection, hypothesis formulation, and the overall model development strategy.
Statistical Testing or Predictive Model Development
Statistical testing and predictive model development involve applying appropriate statistical tests, such as t-tests or ANOVA, to validate hypotheses identified during data exploration.
Predictive or descriptive models are then developed using machine learning or statistical techniques tailored to address specific business questions.
Data is split into training, validation, and testing sets to ensure model generalizability and prevent overfitting. Models are iteratively tuned and evaluated using relevant performance metrics to optimize accuracy and reliability.
Results Visualization and Insight Extraction
Results visualization and insight extraction involve presenting findings through clear, intuitive visualizations such as dashboards, charts, and infographics designed for stakeholder understanding.
Complex analytical outputs are translated into actionable insights with direct business implications.
Incorporating feedback loops by engaging stakeholders allows for refining analyses and adapting recommendations. Transparency regarding assumptions, limitations, and confidence levels is maintained to ensure credibility and informed decision-making.
