Pivot tables are powerful Excel tools that summarize, analyze, and explore large datasets dynamically. They enable multi-dimensional analysis by organizing data across different dimensions and measures, providing flexibility to uncover insights efficiently.
Advanced pivot table features such as grouping, calculated fields, slicers, and timelines enhance reporting capabilities, making data interaction intuitive and insightful.
Creating and Manipulating Pivot Tables for Multi-Dimensional Analysis
It enables users to drag and drop fields into rows, columns, values, and filters to generate cross-tabulated summaries. This allows simultaneous analysis across multiple dimensions, such as evaluating sales by product, region, and time period.
The ability to dynamically rearrange fields makes it easy to answer various business questions quickly without modifying the original dataset.
Grouping Data by Time Periods, Categories, and Custom Groups
It helps simplify large datasets and reveal broader patterns for targeted analysis. Time-based grouping allows data to be aggregated by day, month, quarter, or year, which is especially useful for identifying trends.
Category grouping, such as by product type, customer segment, or region, helps compare performance across key business dimensions.
Additionally, custom groups enable users to combine specific items into meaningful sets, such as merging minor product categories, providing more focused and actionable insights.
Calculated Fields and Items for Derived Metrics within Pivot Tables
It allow users to extend their analysis without altering the source data. Calculated fields generate new metrics by applying formulas to existing fields, such as computing profit margin using revenue and cost.
Calculated items, on the other hand, perform operations on individual items within a field, like creating a “Total Sales” item by combining several product categories.
These features significantly enhance the analytical capabilities of pivot tables, supporting scenario analysis and enabling the creation of key performance indicators (KPIs) directly within reports.
Slicers and Timelines for Interactive Dashboard Functionality
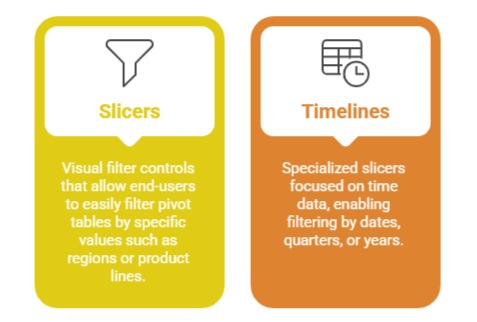
These tools provide interactive, user-friendly dashboards where users can drill down, filter, and explore data dynamically. They promote engaging data storytelling and real-time decision support.
