Financial data analysis is essential for understanding a company's financial health, performance, and operational efficiency.
By examining key financial statements—balance sheet, income statement, cash flow statement—and calculating ratios, stakeholders can evaluate profitability, liquidity, and overall stability, making informed investment and management decisions.
Balance Sheet Analysis: Asset Efficiency and Financial Health
The balance sheet provides a snapshot of a company's financial position at a specific point in time, detailing assets, liabilities, and shareholders' equity.
Analyzing asset efficiency involves assessing how well the company utilizes its assets to generate revenue. Key ratios such as asset turnover and return on assets (ROA) help evaluate operational efficiency.
Fundamentally, a healthy balance sheet indicates a robust asset base, manageable liabilities, and solid equity, which collectively suggest financial stability and capacity for growth.
Income Statement Analysis: Profitability Trends and Cost Structures
The income statement, also known as the profit and loss statement, records revenues, expenses, and profits over a period. Profitability analysis involves examining gross profit margins, operating margins, and net profit margins over multiple periods to identify trends.
Key points include:
1. Revenue Trends: Consistent growth signals effective sales strategies.
2. Cost Structures: Tracking variable and fixed costs reveals efficiency or need for optimization.
3. Profit Margins: Understanding how much profit is retained from sales helps in assessing overall profitability and operational effectiveness.
Income statement analysis provides critical insights into whether a company is becoming more or less profitable over time.
Cash Flow Analysis: Liquidity and Operational Efficiency
The cash flow statement reports cash inflows and outflows from operations, investing, and financing activities. It assesses liquidity and the company's ability to fund operations, pay debts, and invest for future growth.
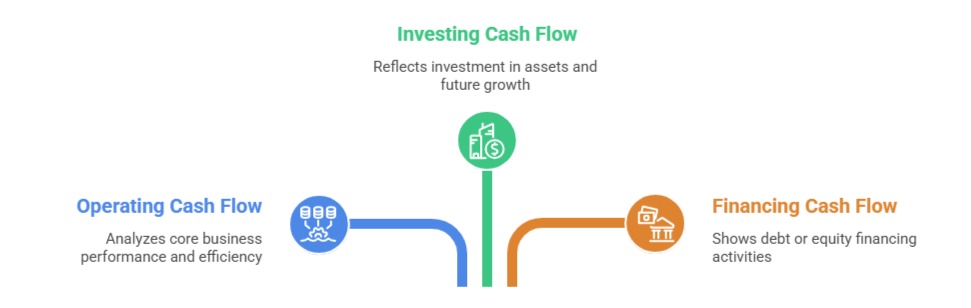
Healthy cash flow ensures the company can meet short-term obligations and fund strategic initiatives.
Financial Ratio Analysis: Benchmarking and Performance Comparison
Financial ratios transform raw data into meaningful metrics for comparison and benchmarking:
1. Profitability Ratios: Gross margin, operating margin, net profit margin.
2. Liquidity Ratios: Current ratio, quick ratio.
3. Leverage Ratios: Debt-to-equity, interest coverage ratio.
4. Efficiency Ratios: Asset turnover, receivables days.
These ratios facilitate peer comparisons, industry benchmarking, and trend analysis to evaluate competitive positioning and operational efficiency.

Class Sessions
Sales Campaign

We have a sales campaign on our promoted courses and products. You can purchase 1 products at a discounted price up to 15% discount.