Data modeling enhances the analytical power of Excel by enabling users to create relationships between tables and analyze complex datasets more efficiently.
Excel’s Data Model and Power Pivot add robust capabilities for handling large, multi-source data, supporting more sophisticated financial reporting and business insights.
Moreover, query techniques streamline data preparation, improving the accuracy and speed of analysis. These tools collectively empower business professionals to perform advanced analytics within familiar environments.
Data Model in Excel: Creating Relationships Between Tables
Excel’s Data Model enables users to combine multiple tables into a unified structure without needing to merge them into a single flat dataset. By defining relationships through key columns,
Excel performs lookups and joins across tables seamlessly, preserving data granularity and optimizing storage for scalable analysis.
This relational approach allows analysts to build complex reports by simply dragging fields from different tables, while Excel automatically manages the underlying connections between datasets.
This feature turns Excel into a rudimentary relational database, simplifying multi-table analysis.
Power Pivot for Advanced Analytics with Large Datasets
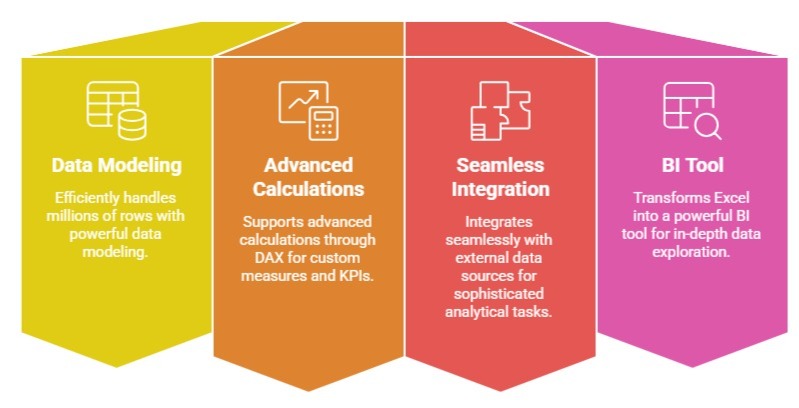
It equips Excel with powerful data modeling capabilities, enabling it to efficiently handle millions of rows.
It supports advanced calculations through Data Analysis Expressions (DAX), allowing users to create custom measures, KPIs, and hierarchies for in-depth analysis and drill-down reporting.
Power Pivot also integrates seamlessly with external data sources such as SQL Server, Access, and cloud platforms, making it an essential tool for sophisticated, large-scale analytical tasks.
With Power Pivot, Excel becomes a powerful BI tool for in-depth data exploration and advanced reporting.
Using Data Model for Complex Multi-Source Financial Reporting
It allows businesses to combine financial information from various systems such as ERP platforms, accounting software, and spreadsheets.
Through Power Pivot, organizations can generate consolidated reports like profit and loss statements, budgets, and forecasts across different departments or subsidiaries.
Financial analysts can then dynamically slice and analyze the data by dimensions such as time, region, or cost center.
This approach significantly reduces manual reconciliation efforts and improves accuracy by maintaining automated and consistent data relationships.
These capabilities improve transparency and decision-making in financial management.
Query Techniques for Efficient Data Preparation
Query techniques for efficient data preparation in Excel rely heavily on Power Query, which enables users to extract, transform, and load (ETL) data before analysis.
Power Query automates repetitive cleaning tasks such as filtering, merging, pivoting, and unpivoting data, making the preparation process faster and more consistent.
It can also pull data from multiple sources, ensuring smooth integration within Excel.
Additionally, query folding enhances performance by pushing filtering and transformation operations back to the data source whenever possible, resulting in more efficient processing.
Effective query techniques enable analysts to focus on insights rather than manual data wrangling.

Class Sessions
Sales Campaign

We have a sales campaign on our promoted courses and products. You can purchase 1 products at a discounted price up to 15% discount.