Tableau and Power BI are leading business intelligence (BI) tools that empower professionals to create interactive dashboards, visualize complex data, and deliver actionable insights.
Both platforms offer robust capabilities but differ in their strengths, particularly in ecosystem integration and user experience.
Tableau: Creating Interactive Dashboards and Visual Stories
Tableau enables users to create interactive dashboards and visual stories through a user-friendly drag-and-drop interface that requires minimal coding.
It connects seamlessly to various data sources, including cloud databases and on-premises systems, supporting both live and extract data connections.
Its visual storytelling features—such as animations, filters, and highlight actions—enhance user engagement and help uncover insights more effectively. Tableau dashboards can also be embedded into websites or applications, making data widely accessible.
With advanced visualization capabilities and a strong emphasis on design aesthetics, Tableau is ideal for deep analytical exploration and compelling data communication.
Power BI: Integrating with Microsoft Ecosystem for Reporting
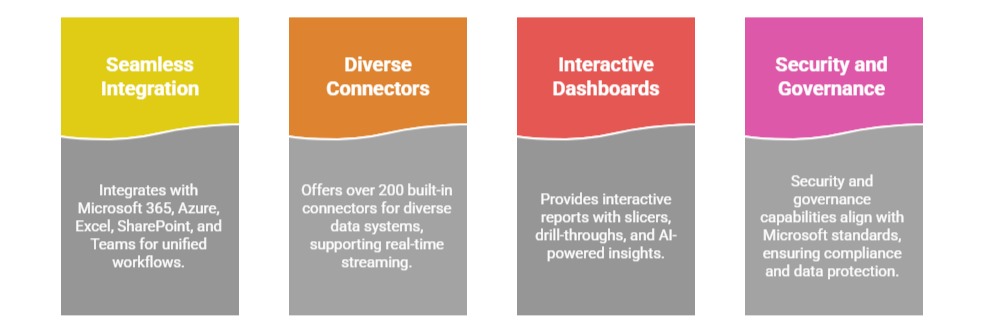
Power BI integrates seamlessly with the Microsoft ecosystem, including Microsoft 365, Azure, Excel, SharePoint, and Teams, enabling unified workflows across platforms.
It offers over 200 built-in connectors for diverse data systems, supporting real-time streaming and hybrid data models.
Power BI dashboards provide interactive reports with features such as slicers, drill-throughs, and AI-powered insights. Its security and governance capabilities align with Microsoft standards, ensuring compliance and robust data protection.
This makes Power BI an effective solution for organizations using Microsoft products that seek rapid adoption and enterprise-wide deployment.
Dashboard Design for Different Stakeholder Audiences
Dashboard design should be tailored to the needs of different stakeholder audiences.
Executives typically prefer concise, high-level KPIs and visual summaries that emphasize strategic impact, while operational teams benefit from detailed, process-oriented dashboards with real-time monitoring.
Technical users, on the other hand, require access to raw data, comprehensive metrics, and drill-down capabilities for in-depth analysis and diagnostics.
Both Tableau and Power BI support role-based access, personalized views, and flexible report distribution, ensuring that dashboards effectively meet the specific needs of each audience.
Drill-down Capabilities and Interactive Exploration Features
Drill-down capabilities and interactive exploration features in Tableau and Power BI allow users to move seamlessly from high-level summaries to detailed, granular data.
Users can filter, highlight, and explore data points interactively, enabling self-service analytics and personalized insights.
Hierarchical drill paths support both temporal analysis, such as moving from year to month, and categorical analysis, like navigating from region to store.
These interactive elements promote deeper understanding and faster decision-making by revealing underlying trends and root causes.

Class Sessions
Sales Campaign

We have a sales campaign on our promoted courses and products. You can purchase 1 products at a discounted price up to 15% discount.