A dataset in isolation tells you nothing. It is only when you move through a structured, step-by-step analytical process that the data begins to reveal its story.
An end-to-end data analysis case study brings together every skill covered like loading data, cleaning it, exploring it visually, extracting statistical insights, and communicating findings — into one cohesive workflow.
The Problem Statement
Before writing a single line of code, a clear question must be defined. In this case study, the business question is:
"Which customer segments and product categories are driving the most revenue, and what patterns exist in purchasing behaviour?"
Every step in the analysis is guided by this question. Without a clear problem statement, analysis becomes aimless exploration.
Step 1 — Loading the Dataset
The first step is importing the necessary libraries and loading the dataset into a Pandas DataFrame.

Step 2 — Initial Data Inspection
Before doing anything else, inspect the dataset to understand its structure — how many rows and columns exist, what data types are present, and whether missing values are visible at a glance.

This step answers the question: "What exactly do I have?" It prevents assumptions and grounds the entire analysis in reality.
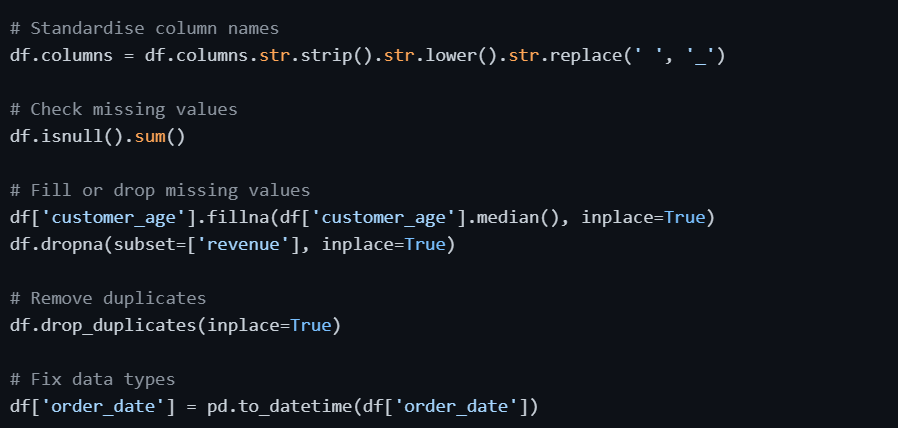
Step 3 — Data Cleaning
Real datasets are rarely clean. This step handles missing values, removes duplicates, fixes data types, and standardises column names.
Step 4 — Feature Selection
Not every column contributes to answering the business question. Irrelevant columns such as row IDs or internal tracking codes are removed, and highly correlated or low-variance features are filtered out.

Retain only the columns that are directly relevant — customer segment, product category, order date, quantity, and revenue.
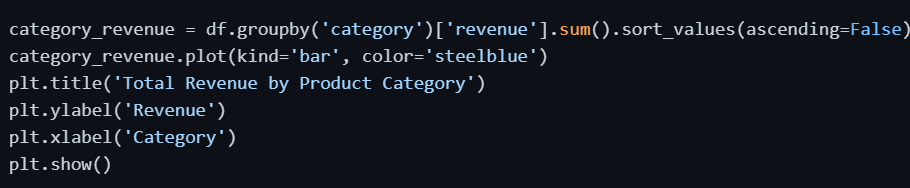
Step 5 — Exploratory Data Analysis (EDA)
This is the core of the case study. EDA uncovers patterns, trends, outliers, and relationships within the data.
Revenue by Product Category:
Revenue by Customer Segment:
.png)
Monthly Revenue Trend:

Distribution of Revenue:

Correlation Heatmap:

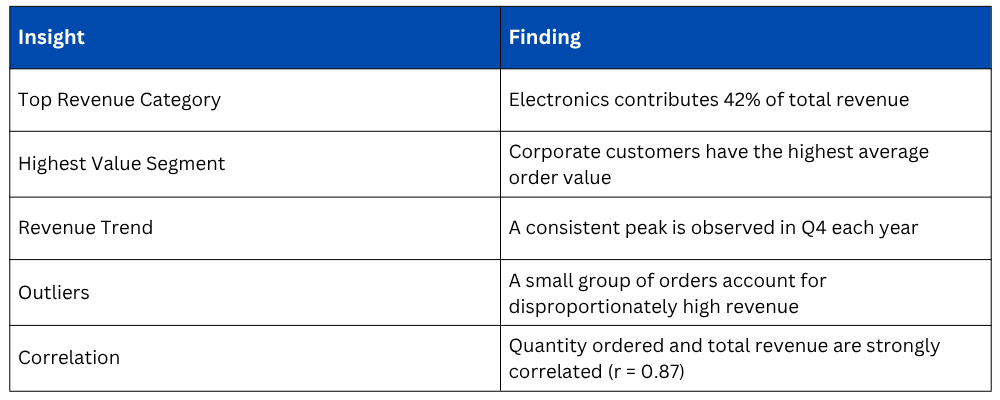
Step 6 — Key Insights and Findings
Once the visualisations are complete, the findings are summarised in plain language. This is what stakeholders actually care about. Below is how findings from this case study would typically be presented:
Step 7 — Communicating the Results
Analysis only has value when it is clearly communicated. The final step involves structuring findings into a narrative — what was found, why it matters, and what action it suggests.
A well-presented analysis answers the original business question directly, supports every claim with a chart or statistic, and avoids overwhelming the audience with unnecessary technical detail.
A good summary of findings for this case study would look like this: "Electronics is the highest-revenue category, corporate customers deliver the most value per order, and Q4 consistently outperforms other quarters — suggesting targeted promotions in this period would yield the highest return."

Class Sessions
Sales Campaign

We have a sales campaign on our promoted courses and products. You can purchase 1 products at a discounted price up to 15% discount.