Once you load a dataset into a Pandas DataFrame, the very first thing you should do before any analysis is inspect your data.
Data inspection helps you understand the structure, size, content, and quality of your dataset — answering questions like: How many rows and columns do I have? What data types are present? Are there missing values? What do the actual values look like?
Pandas provides three essential methods — .head(), .info(), and .describe() that together give you a complete first look at your data.
Setting Up — Loading a Sample Dataset
Before diving into inspection methods, let's load a dataset to work with.

.head() and .tail() — Viewing Your Data
.head() displays the first n rows of your DataFrame. By default, it returns the first 5 rows. This gives you an immediate visual of what your data actually looks like the column names, the kind of values stored, and the general structure.
 and .tail () - Viewing your data.png)
Similarly, .tail() shows the last n rows of the DataFrame, which is useful for checking whether data loads completely or if there are any trailing issues.
.png)
Sample Output of .head()
.png)
At a glance, you can already see column names, data types, and value formats, all without writing any extra code.
When to use:
1. Right after loading a dataset to confirm it loaded correctly.
2. To visually verify column names and data values.
3. To spot obvious formatting issues (extra spaces, wrong separators, etc.).
.info() — Understanding Structure and Data Types
.info() provides a technical summary of your DataFrame, the number of rows, column names, non-null counts, and data types. This is your go-to method for spotting missing values and understanding how Pandas has interpreted each column.
.png)
Sample Output
.png)
What to look for in .info() output
1. Non-Null Count: If a column shows 195 non-null out of 200 rows, that means 5 missing values exist in that column. This is the fastest way to detect missing data.
2. Dtype (Data Type): Check whether Pandas has correctly identified each column's type. For example, Joining_Date is showing as object (string) instead of datetime — this tells you a type conversion is needed before date-based analysis.
3. Memory Usage: Useful when working with large datasets to understand how much RAM your DataFrame is consuming.
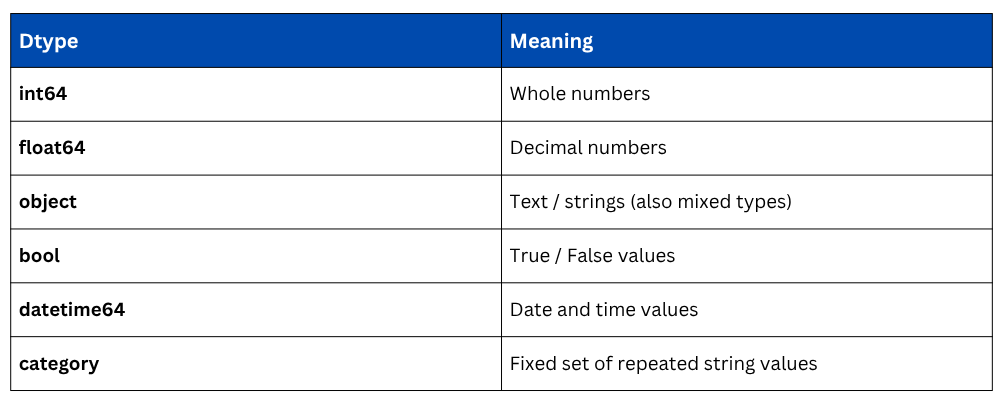
Common Dtype values in Pandas
.describe() — Statistical Summary of Your Data
.describe() generates descriptive statistics for all numerical columns in your DataFrame. It instantly gives you the count, mean, standard deviation, minimum, maximum, and quartile values, helping you understand the distribution and spread of your data.
.png)
Sample Output
.png)
Understanding each metric
1. count: Number of non-null values. If this differs from total rows, missing values exist.
2. mean: Average value of the column.
3. std: Standard deviation; measures how spread out values are from the mean.
4. min / max: The smallest and largest values. Useful for spotting outliers.
5. 25%, 50%, 75%: Quartile values. The 50% value is the median. Together, these describe the data distribution.
By default, .describe() only summarizes numerical columns. To include text/categorical columns, use the include parameter.
 1.png)
Sample Output for object columns

Here, unique shows the number of distinct values, top shows the most frequent value, and freq shows how many times it appears.
Using All Three Together
In practice, these three methods are always used together immediately after loading data, forming a quick data orientation routine.
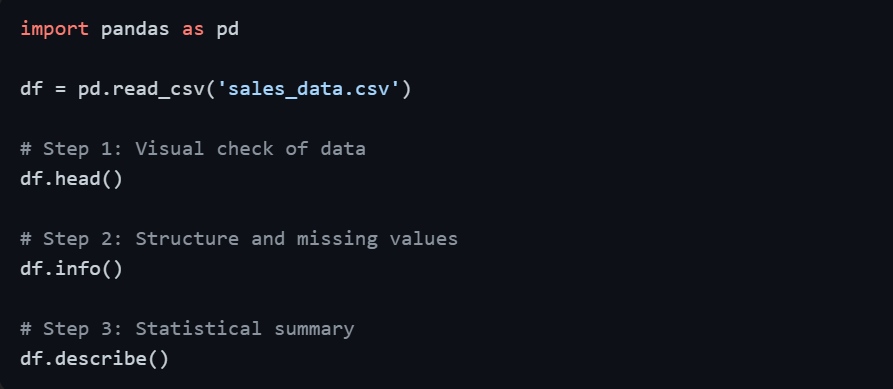
This three-step routine takes less than a minute but tells you everything you need to plan your data cleaning and analysis strategy.

Class Sessions
Sales Campaign

We have a sales campaign on our promoted courses and products. You can purchase 1 products at a discounted price up to 15% discount.