Seaborn is a Python data visualization library built directly on top of Matplotlib, designed to make statistical visualizations easier to create and more visually appealing by default.
While Matplotlib gives you complete control and flexibility, it often requires many lines of code to produce a polished chart. Seaborn solves this by providing high-level functions that generate complex, informative plots with minimal code.
It also integrates seamlessly with Pandas DataFrames, making it a natural fit for data analysis workflows. If Matplotlib is the engine, Seaborn is the refined interface that makes the drive smoother.
Installing and Importing Seaborn
Seaborn comes pre-installed with the Anaconda distribution. If you are working in a standard Python environment, you can install it using pip.

The standard import convention used across all projects and documentation is:

Seaborn is always imported alongside Matplotlib because plt.show() is still used to render charts, and Matplotlib handles all the underlying figure management.
Seaborn vs. Matplotlib — Key Differences
Both libraries serve the same ultimate purpose, but they approach visualization differently. Understanding the distinction helps you decide which tool to reach for in different situations.
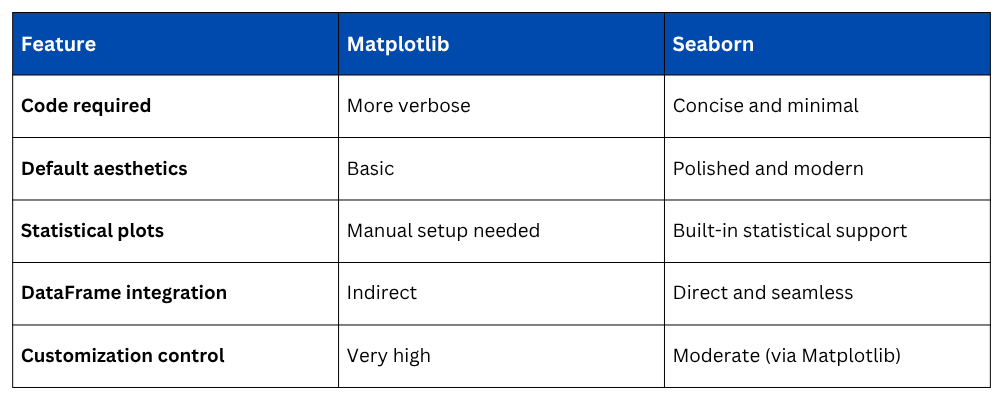
Seaborn is not a replacement for Matplotlib, it is a complement. For quick, beautiful statistical charts, use Seaborn. For fine-grained customization, drop down to Matplotlib.
The Dataset Used in Examples
Seaborn comes with several built-in practice datasets that are perfect for learning. Throughout this section, the tips dataset is used — a real-world dataset containing restaurant bill and tip information.

This dataset includes columns such as total_bill, tip, sex, smoker, day, time, and size — a rich mix of numerical and categorical variables ideal for demonstrating different plot types.
Basic Plots in Seaborn
1. Scatter Plot — scatterplot()
A scatter plot in Seaborn is created with a single line and automatically handles axis labels from the DataFrame column names.
.png)
The hue parameter automatically assigns different colors to categories — in this case, distinguishing between male and female customers, without any extra code.
2. Line Plot — lineplot()
A line plot is used for trends and continuous data. Seaborn's lineplot() automatically calculates and displays a confidence interval band around the line, showing data variability.
.png)
3. Bar Plot — barplot()
Seaborn's bar plot displays the mean value of a numerical variable for each category, and automatically includes error bars representing the confidence interval.
.png)
This is significantly more informative than a standard Matplotlib bar chart because it shows not just the value but also the uncertainty around it.
4. Histogram — histplot()
The histplot() function creates a histogram and optionally overlays a KDE (Kernel Density Estimate) curve — a smooth line showing the overall shape of the distribution.
.png)
Setting kde=True adds the density curve automatically — something that requires additional steps in Matplotlib.
5. Box Plot — boxplot()
A box plot summarizes data distribution by showing the median, interquartile range, and outliers — all in a single compact visual.
.png)
Box plots are especially useful for comparing distributions across multiple categories and spotting outliers at a glance.
6. Heatmap — heatmap()
A heatmap visualizes a matrix of values using color intensity, most commonly used to display correlation matrices between numerical variables.
.png)
1. annot=True — displays the actual correlation values inside each cell
2. cmap — sets the color palette ("coolwarm", "Blues", "YlGnBu")
3. fmt=".2f" — formats numbers to 2 decimal places
Styling in Seaborn
One of Seaborn's biggest advantages is its built-in styling system, which controls the overall look of all charts with a single line of code.
Setting a Theme — sns.set_theme()
.png)
Available Style Options
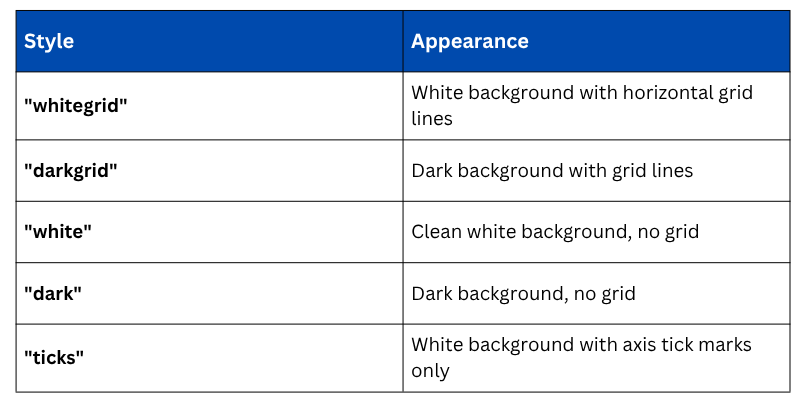
"whitegrid" is the most widely used style for data analysis reports because it is clean, minimal, and easy to read.
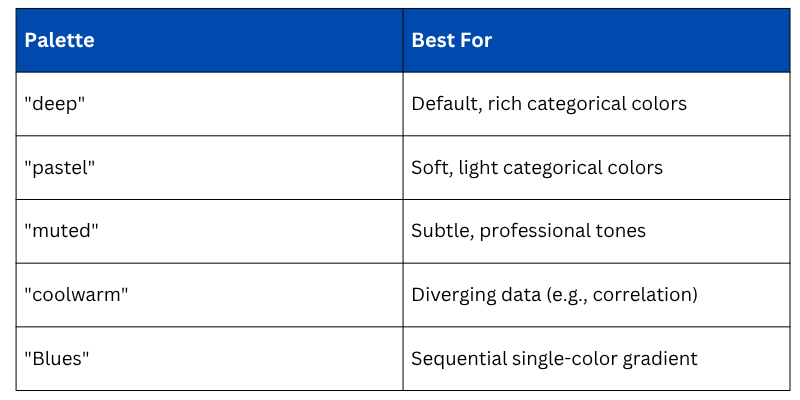
Changing Color Palettes
Seaborn's color palettes control how categories and gradients are colored across all chart types. You can apply a palette globally or per plot.

Commonly Used Palettes
Combining Seaborn with Matplotlib Customization
Since Seaborn is built on Matplotlib, you can always use Matplotlib commands to add finishing touches to any Seaborn chart.
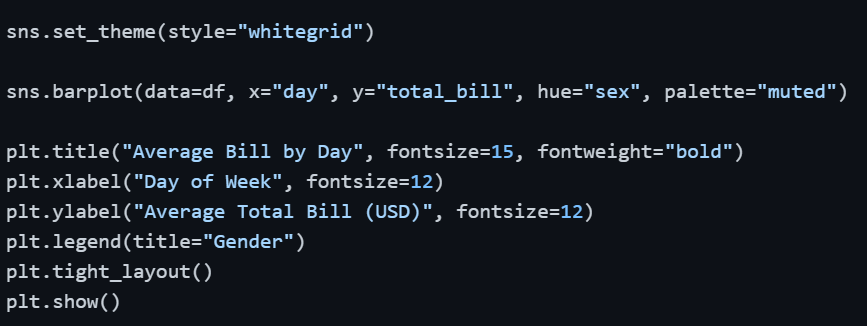
This combination gives you the best of both worlds — Seaborn's statistical intelligence and Matplotlib's precise customization control.

Class Sessions
Sales Campaign

We have a sales campaign on our promoted courses and products. You can purchase 1 products at a discounted price up to 15% discount.