Data gets lost during collection, entry errors occur, systems fail to record certain fields, or respondents skip questions in surveys. If left unaddressed, missing values can distort your analysis, produce incorrect statistics, and break machine learning models.
Pandas represents missing values as NaN (Not a Number) for numerical data and None for object types. Knowing how to detect, understand, and handle them appropriately is one of the most critical skills in data cleaning.
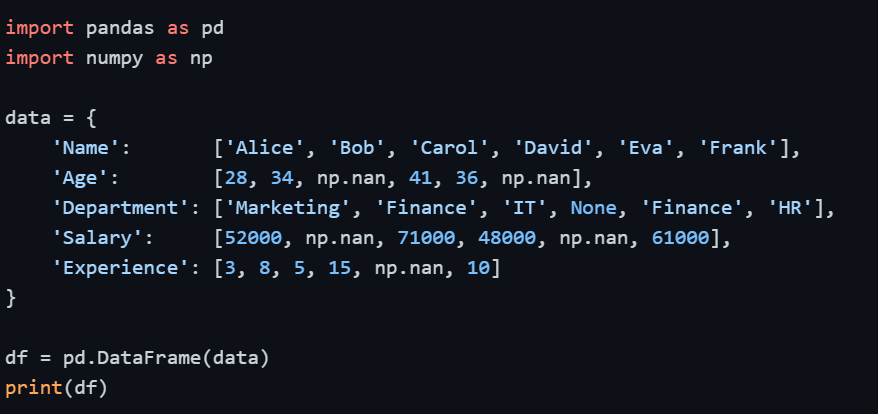
Setting Up — Sample DataFrame with Missing Values
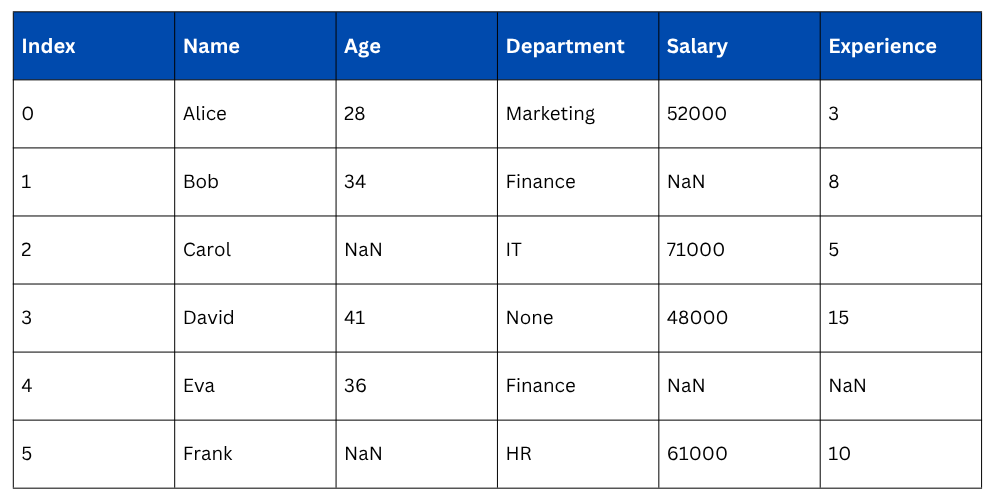
Output
Detecting Missing Values
Before handling missing values, you need to know where they are and how many exist. Pandas provides straightforward methods for this.
Checking for Missing Values — isnull() and isna()
Both isnull() and isna() are identical in function — they return a DataFrame of boolean values where True indicates a missing value.
 and isna().png)
Output of .isnull().sum()
.sum().png)
Percentage of Missing Values per Column
Knowing the count alone is sometimes not enough — the percentage tells you how severe the missing data problem is for each column.


Check if Any or All Values are Missing

Strategies for Handling Missing Values
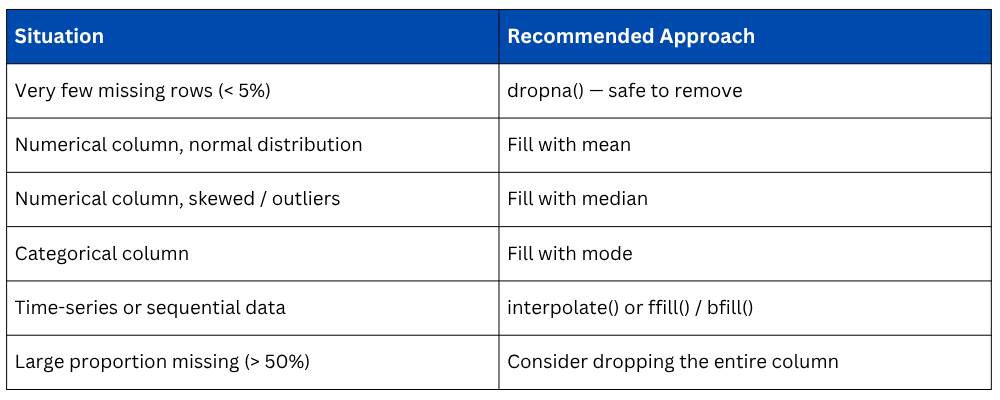
There is no single universal solution for missing data. The right approach depends on the nature of the data, how much data is missing, and what the column represents. The three main strategies are: removing missing data, filling missing data, or interpolating it.
Removing Missing Values — dropna()
dropna() removes rows or columns that contain missing values. This approach works well when the missing data is minimal and removing those rows won't significantly reduce your dataset size.
Drop Rows with Any Missing Value

Output: Only rows with no missing values in any column are kept (only Alice in this case).
Drop Rows where All Values are Missing

Drop Rows based on a Specific Column

Drop Columns with Missing Values

Key Parameters of dropna()
.png)
When to use: Only when missing data is a small fraction of your dataset (generally less than 5%) and removing those rows won't introduce bias.
Filling Missing Values — fillna()
Instead of removing missing data, you can replace it with meaningful values. This is the preferred approach when you cannot afford to lose rows, especially in smaller datasets.
Fill with a Constant Value

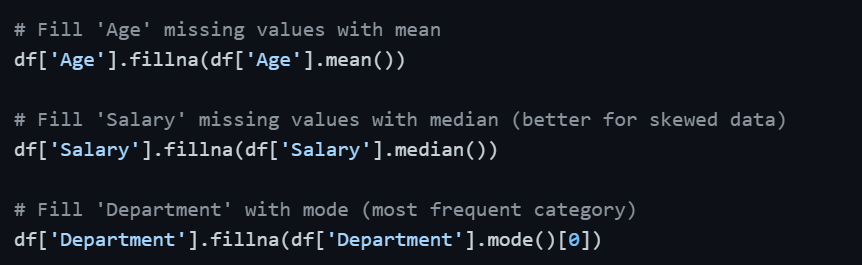
Fill with Mean, Median, or Mode
This is the most common approach for numerical columns. The choice between mean, median, and mode depends on the data distribution.
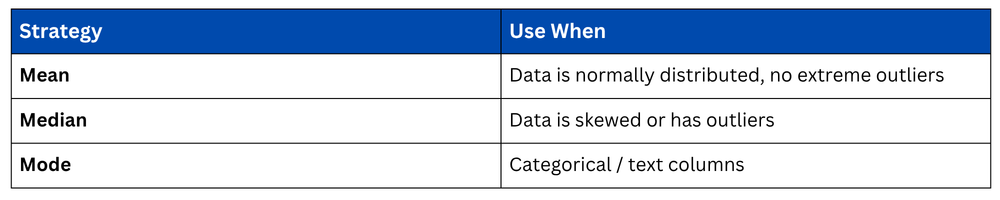
When to use Mean vs Median vs Mode
Forward Fill and Backward Fill
These methods are especially useful for time-series data where values follow a sequential pattern. Forward fill propagates the last valid value forward; backward fill does the opposite.
Filling with Interpolation — interpolate()
Interpolation estimates missing values based on surrounding data points. It is particularly effective for numerical columns with a natural progression such as time-series or sequential measurements.
.png)
For example, if Salary values are 50000, NaN, 70000 — interpolation fills the NaN with 60000, which is the midpoint. This is more intelligent than simply using the mean.
Applying Changes Permanently — inplace Parameter
By default, all Pandas operations return a new DataFrame without modifying the original. To save changes to the original DataFrame, use inplace=True or reassign.

Practical Workflow — Handling Missing Values End-to-End
In practice, handling missing values follows a logical sequence rather than applying a single method blindly.
import pandas as pd
import numpy as np
# Step 1: Detect missing values
print(df.isnull().sum())
# Step 2: Calculate missing percentage
print((df.isnull().sum() / len(df)) * 100)
# Step 3: Fill numerical columns with median
df['Age'] = df['Age'].fillna(df['Age'].median())
df['Salary'] = df['Salary'].fillna(df['Salary'].median())
df['Experience'] = df['Experience'].fillna(df['Experience'].median())
# Step 4: Fill categorical column with mode
df['Department'] = df['Department'].fillna(df['Department'].mode()[0])
# Step 5: Verify no missing values remain
print(df.isnull().sum())
Choosing the Right Strategy

Class Sessions
Sales Campaign

We have a sales campaign on our promoted courses and products. You can purchase 1 products at a discounted price up to 15% discount.