Loading a dataset is just the beginning. In the real world, raw data is almost never analysis-ready. It arrives with missing values, duplicate records, inconsistent formatting, incorrect data types, and outliers that can silently corrupt your results if left unaddressed.
Studies consistently show that data analysts spend up to 70–80% of their time cleaning and preparing data before any actual analysis takes place and for good reason.
No matter how sophisticated your analysis techniques are, they will produce unreliable results if the underlying data is dirty.
Data cleaning is the systematic process of detecting and correcting these problems, transforming raw, messy data into a clean, consistent, and trustworthy dataset ready for analysis.
The Data Cleaning Workflow — Step by Step
Data cleaning is not a single action, it is a structured sequence of steps, each addressing a specific category of data quality problem. Following a consistent workflow ensures nothing is missed.
Step 1 — Inspect the Dataset
Before fixing anything, you need to fully understand what you are working with. A thorough inspection reveals exactly what problems exist and where they are located.

This initial inspection gives you a complete picture of data quality issues before you begin addressing them one by one.
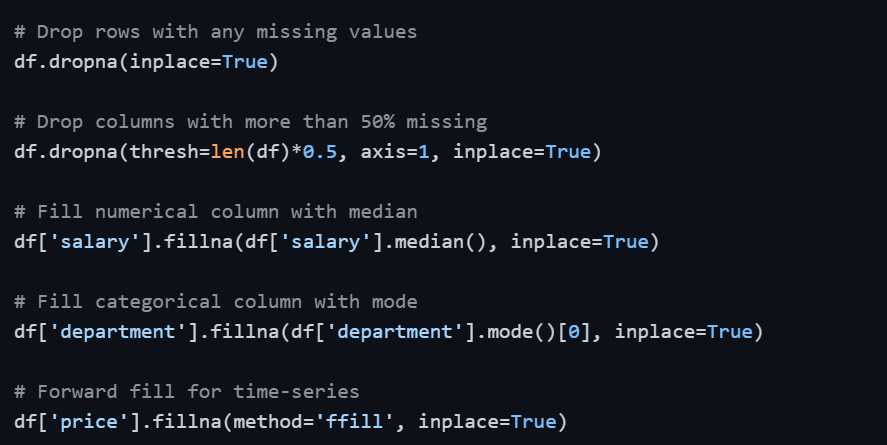
Step 2 — Handle Missing Values
Missing values are the most common data quality issue in any real dataset. Leaving them unaddressed causes errors in calculations, skewed statistics, and broken models.
Detecting missing values:

Strategies for handling missing values:
1. Drop rows: When only a small percentage of rows have missing values and losing them will not significantly impact the dataset.
2. Drop columns: When a column has an excessively high proportion of missing values (typically above 50–60%) and cannot be reliably filled.
3. Fill with mean/median: For numerical columns, filling with the mean works for symmetric data, while the median is preferred when the data is skewed.
4. Fill with mode: For categorical columns, the most frequent value is a reasonable replacement.
5. Forward/Backward fill: For time-series data where the previous or next value is a logical substitute.
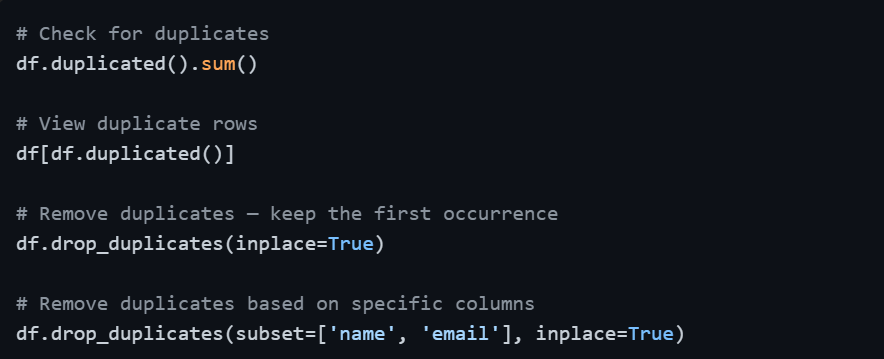
Step 3 — Remove Duplicate Records
Duplicate rows inflate counts, distort aggregations, and produce misleading summaries. They often appear when data is merged from multiple sources or exported multiple times.
Step 4 — Fix Incorrect Data Types
When data is loaded, Pandas sometimes assigns the wrong data type to a column such as a numerical column stored as text, or a date column stored as a generic object. Incorrect types cause calculation errors and prevent proper analysis.
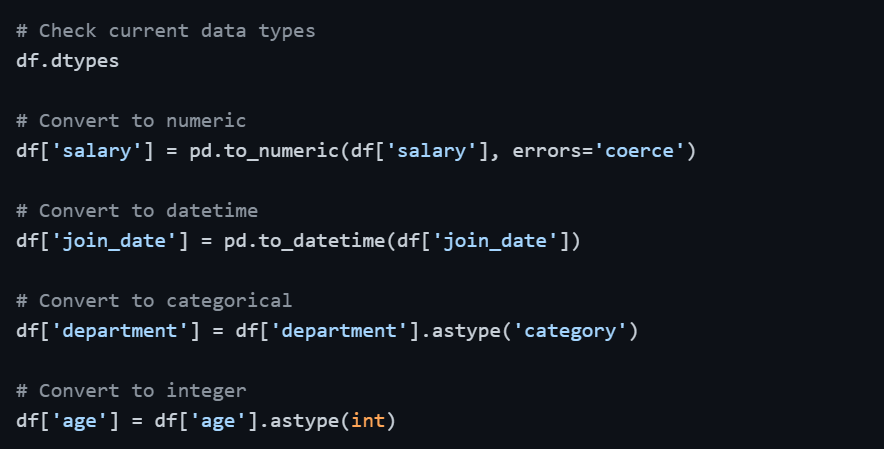
The errors='coerce' parameter in pd.to_numeric() is particularly useful, it converts any value that cannot be parsed as a number into NaN rather than raising an error, which you can then handle as a missing value.
Step 5 — Standardize and Clean Text Data
Text and categorical columns frequently contain inconsistencies — extra spaces, mixed capitalization, typos, and alternate spellings of the same value. These variations make grouping and filtering unreliable.
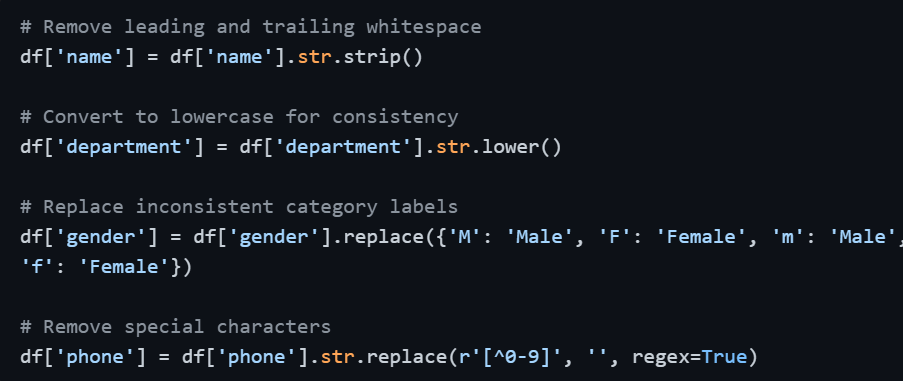
Standardizing text ensures that values like "HR", "hr", and " Hr " are all treated as the same category during grouping and analysis.
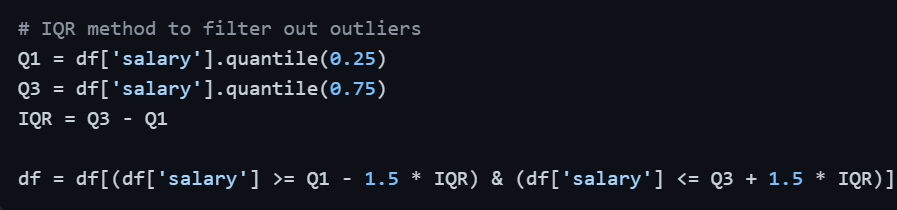
Step 6 — Handle Outliers
Outliers can distort means, inflate standard deviations, and damage model performance. After detecting them using the IQR method or Z-Score, the appropriate action depends on context — remove them if they are errors, or retain them if they represent genuine rare events.
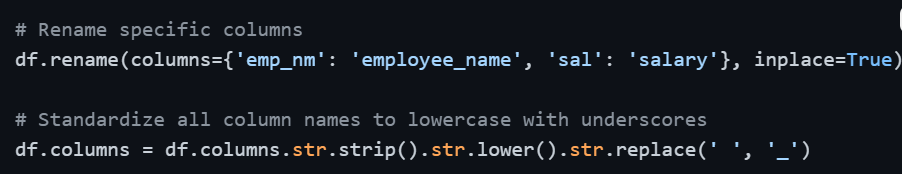
Step 7 — Rename and Reorganize Columns
Column names from raw datasets are often unclear, inconsistent, or poorly formatted — containing spaces, mixed cases, or cryptic abbreviations. Clean, consistent naming makes the rest of the analysis significantly easier.
Step 8 — Validate and Confirm Clean Data
Once all cleaning steps are complete, a final validation pass confirms that all issues have been resolved and the dataset is genuinely ready for analysis.
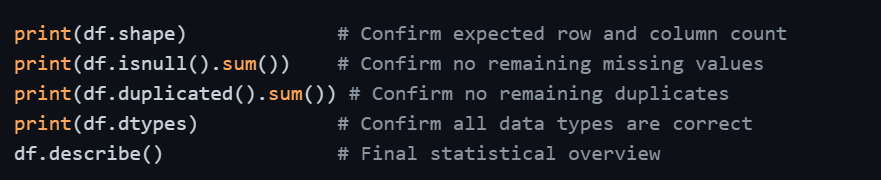
This final check is not optional, it is the quality gate that gives you confidence in everything that follows.

Class Sessions
Sales Campaign

We have a sales campaign on our promoted courses and products. You can purchase 1 products at a discounted price up to 15% discount.