Before diving into complex analysis or building predictive models, every data analyst must first understand what their data looks like at a basic level. Descriptive statistics provide that foundation.
They are the simplest yet most essential tools for summarizing and describing the core characteristics of a dataset. Among all descriptive measures, the three most fundamental are the Mean, Median, and Mode — collectively known as measures of central tendency.
These three values each answer the same basic question in a different way: "Where does the center of my data lie?" Knowing which one to use, and when, is a skill that directly impacts the accuracy and honesty of your analysis.
What are Measures of Central Tendency?
Measures of central tendency summarize an entire dataset with a single representative value that describes where most of the data points cluster.
Think of them as the "typical" value in your data. Each measure defines "typical" differently, and each has situations where it works best and situations where it can mislead.
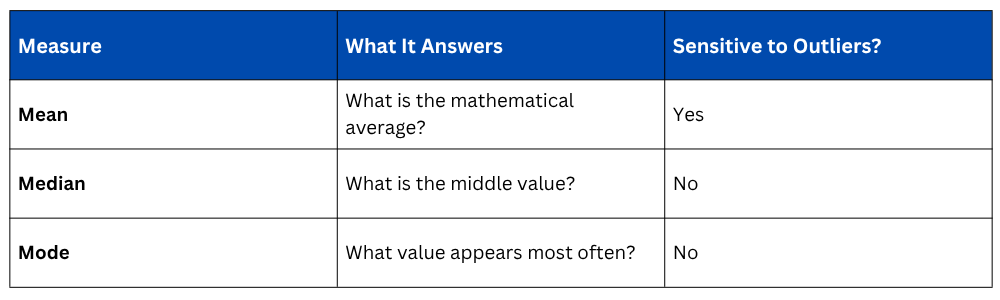
Mean — The Arithmetic Average
The mean is the most commonly used measure of central tendency. It is calculated by adding all values together and dividing by the total number of values. It gives every data point equal weight in the final result.

For example, given the salaries: 40,000 | 45,000 | 50,000 | 55,000 | 60,000


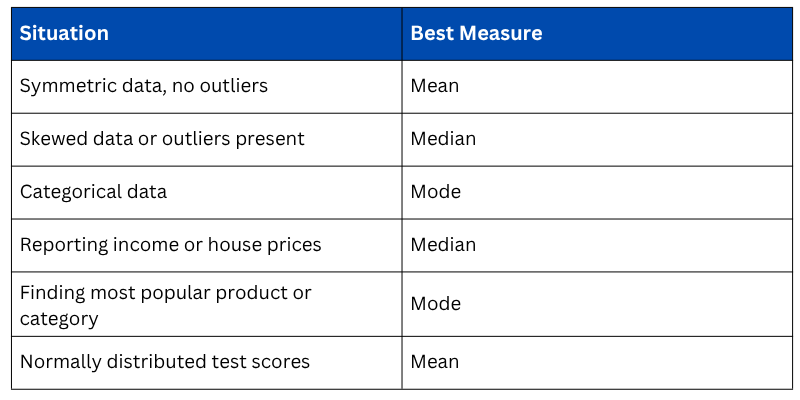
When to use it: The mean works well when data is fairly symmetric and free of extreme outliers. It is ideal for normally distributed data like heights, temperatures, or test scores.
When it misleads: A single extreme value drastically pulls the mean away from the true center. For example, if one salary in the above dataset is 500,000 instead of 60,000, the mean jumps to 138,000 — no longer representative of what most employees earn.
Median — The Middle Value
The median is the middle value when all data points are arranged in ascending order. If the dataset has an even number of values, the median is the average of the two middle values. It is not affected by extreme values, making it a more reliable center measure for skewed data.

For example, given: 40,000 | 45,000 | 50,000 | 55,000 | 60,000 → Median = 50,000
With an outlier: 40,000 | 45,000 | 50,000 | 55,000 | 500,000 → Median still = 50,000
The mean would jump dramatically, but the median holds steady, this is exactly why it is preferred for skewed distributions.

When to use it: The median is the preferred measure whenever your data contains outliers or is skewed. It is the standard measure used for income, house prices, and wealth distribution — all datasets that typically have extreme high-end values.
Mode — The Most Frequent Value
The mode is the value that appears most frequently in a dataset. Unlike the mean and median, the mode can be applied to both numerical and categorical data, making it uniquely versatile.
A dataset can have:
1. One mode (unimodal) — one value appears most frequently.
2. Two modes (bimodal) — two values tie for most frequent.
3. Multiple modes (multimodal) — more than two values share the highest frequency.
4. No mode — all values appear equally often.

For numerical data:

When to use it: The mode is most useful for categorical data such as the most common job title, the most purchased product, or the most frequent city in a customer dataset. For numerical data, it helps identify the most common value in discrete datasets like survey ratings or number of children.
Comparing Mean, Median, and Mode in Skewed Data
The relationship between these three measures reveals the shape of your data distribution — a concept that is fundamental to choosing the right analytical approach.
1. In a perfectly symmetrical (normal) distribution, Mean = Median = Mode. All three values coincide at the center.
2. In a right-skewed (positively skewed) distribution, the mean is pulled to the right by high outliers, making Mean > Median > Mode.
3. In a left-skewed (negatively skewed) distribution, the mean is pulled to the left, making Mean < Median < Mode.
This relationship is why simply reporting the mean without checking the distribution shape can be dangerously misleading.
Computing All Three Together in Python
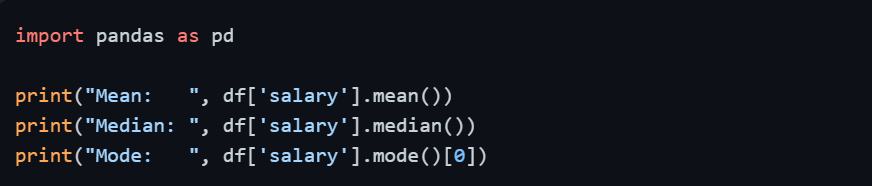
The .describe() method also provides the mean alongside quartile information, giving immediate context around whether the mean and median are aligned or diverging.

A large gap between the mean and median in the .describe() output is a reliable early signal that your data is skewed or contains outliers — something worth investigating before proceeding with further analysis.
Choosing the Right Measure

Class Sessions
Sales Campaign

We have a sales campaign on our promoted courses and products. You can purchase 1 products at a discounted price up to 15% discount.