Outliers are data points that sit far outside the expected range of values in a dataset. They are the unusual observations that do not follow the general pattern of the rest of the data.
Every real-world dataset contains them, a customer who spends 10 times more than the average, a temperature reading that is clearly a sensor error, or a salary entry that was accidentally recorded as 10,000,000 instead of 100,000.
Detecting outliers early is one of the most critical steps in data analysis because they can silently distort your results, skew your statistics, and lead to completely wrong conclusions if left unaddressed.
What is an Outlier?
An outlier is any observation that deviates significantly from the majority of data points in a dataset. Outliers are not always errors, they can also be genuine, rare events worth investigating. Understanding why an outlier exists is just as important as detecting it.
There are three common types of outliers:
1. Global Outlier: A single data point that is extreme compared to the entire dataset (e.g., a transaction of $500,000 in a dataset where the average is $200).
2. Contextual Outlier: A value that is unusual only in a specific context (e.g., a temperature of 35°C in winter but perfectly normal in summer).
3. Collective Outlier: A group of data points that together are unusual, even if each individual point seems normal on its own.
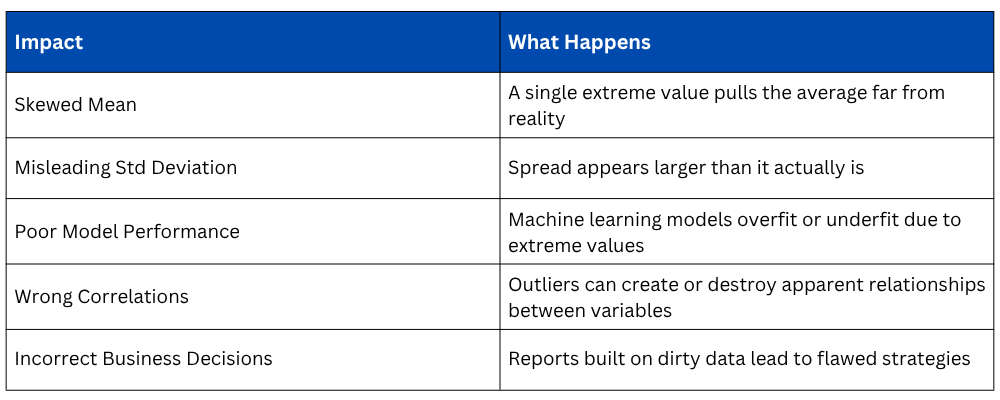
Why Outliers Matter
Outliers, if ignored, silently damage the quality of your analysis in several ways.
Methods to Detect Outliers
1. Visualizing with a Box Plot
A box plot is the fastest and most intuitive way to spot outliers. It displays the median, interquartile range (IQR), and any points that fall beyond the whiskers, those points are your outliers.

Any dot plotted beyond the whiskers of the box plot is flagged as a potential outlier.
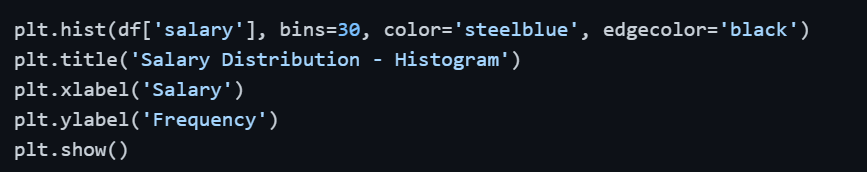
2. Visualizing with a Histogram
A histogram shows the frequency distribution of your data. Outliers appear as isolated bars sitting far away from the main distribution.
3. Visualizing with a Scatter Plot
When working with two variables, a scatter plot reveals data points that are far removed from the main cluster of observations.
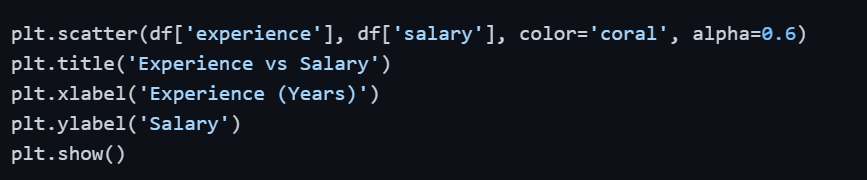
A point sitting far from the central cluster is a strong candidate for an outlier.
4. The IQR Method (Statistical Detection)
The Interquartile Range (IQR) method is the most widely used statistical technique for outlier detection. It defines outliers as any values that fall below Q1 or above Q3 by more than 1.5 times the IQR.
The formula is:
IQR=Q3−Q1
Lower Bound=Q1−1.5×IQR
Upper Bound=Q3+1.5×IQR
Any value outside these bounds is considered an outlier.
.png)
5. The Z-Score Method
The Z-Score measures how many standard deviations a data point is away from the mean. A data point with a Z-Score beyond ±3 is typically considered an outlier.
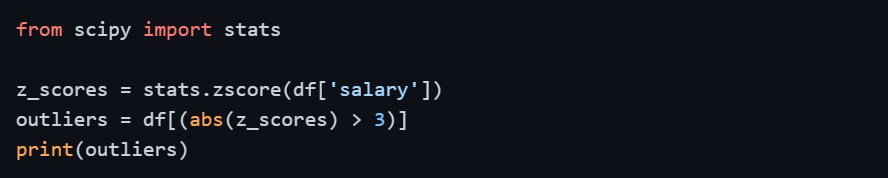
This method works best when your data is approximately normally distributed.
What to Do After Detecting Outliers
Detecting an outlier is only half the job, deciding what to do with it requires context and judgment.
1. Investigate first: Understand why the outlier exists before taking any action.
2. Remove it: If it is a clear data entry error or recording mistake, it should be dropped.
3. Keep it: If the outlier represents a genuine rare event (fraud, record sale), it is valuable and should be retained.
4. Cap it: Replace extreme values with the upper or lower boundary (a technique called Winsorization).
5. Separate it: Analyze outliers as their own group if they represent a meaningful segment.
