Python has emerged as the dominant programming language for data analysis, and for good reason. Its combination of simplicity, powerful libraries, and versatility makes it the preferred choice for beginners and experts alike.
Whether you're analyzing sales data for a small business or processing millions of records for a global corporation, Python provides the tools you need.
Why Python for Data Analysis?
When it comes to working with data, you have several programming options—R, SQL, Java, and others. So why has Python become the go-to choice?
1. Simplicity and Readability
Python's syntax reads almost like English. Compare a Python command to accomplish a task versus the same operation in other languages, and you'll immediately notice the difference. This clarity reduces the learning curve and allows you to focus on solving problems rather than deciphering code.
2. Comprehensive Ecosystem
Python isn't just one tool—it's an entire toolkit. Specialized libraries handle every aspect of data work, from reading files to building machine learning models. You don't need to reinvent the wheel; someone has already built the solution you need.
3. Community Support
With millions of Python users worldwide, you're never alone when facing a challenge. Online forums, tutorials, documentation, and Stack Overflow discussions provide answers to virtually any question. This collaborative environment accelerates learning and problem-solving.
4. Versatility Beyond Data Analysis
Python handles web development, automation, artificial intelligence, and more. Learning Python for data analysis opens doors to other domains, making it a valuable long-term investment in your skill set.
Core Python Libraries for Data Analysis
Python's strength lies in its libraries—pre-written code that extends Python's capabilities. Here are the essential tools you'll use:
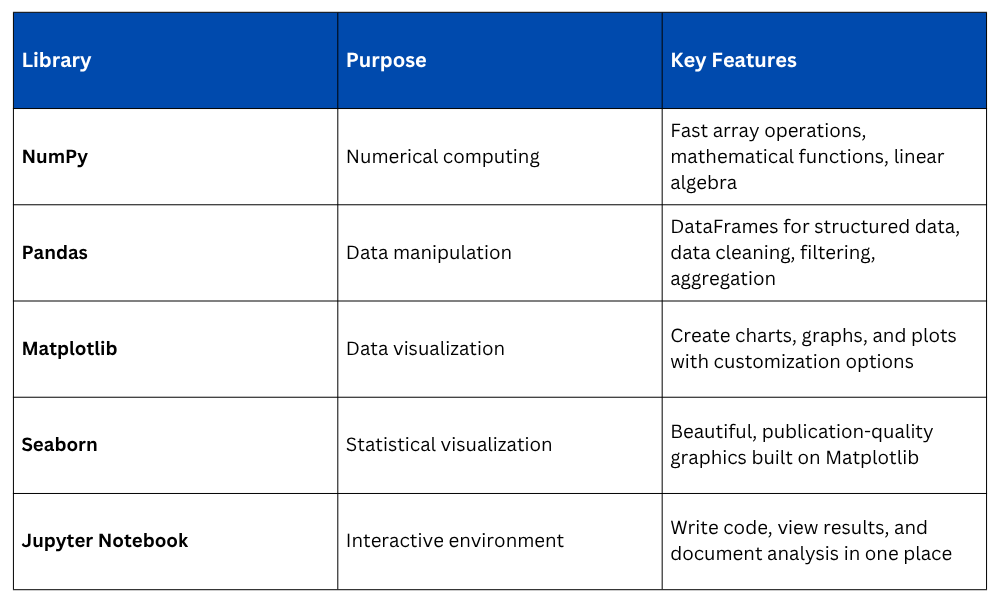
NumPy: The Foundation
NumPy (Numerical Python) provides the fundamental building blocks for data analysis. It handles arrays—collections of numbers arranged in rows and columns—much faster than standard Python lists. When you're processing thousands or millions of data points, this speed difference becomes critical.
Pandas: The Workhorse
If NumPy is the foundation, Pandas is the main tool you'll use daily. It introduces DataFrames, which are essentially spreadsheets in code form. You can read CSV files, filter rows, calculate statistics, merge datasets, and transform data—all with intuitive commands.
Matplotlib and Seaborn: Visual Storytelling
Numbers alone don't always communicate insights effectively. These visualization libraries turn data into charts, helping you spot trends, identify outliers, and present findings to non-technical audiences.
Jupyter Notebook: Your Workspace
Unlike traditional programming where you write entire scripts before running them, Jupyter Notebook lets you execute code in small chunks, see immediate results, and combine code with explanatory text. This interactive approach is perfect for exploration and learning.
Python's Data Analysis Workflow
A typical data analysis project in Python follows this pattern:
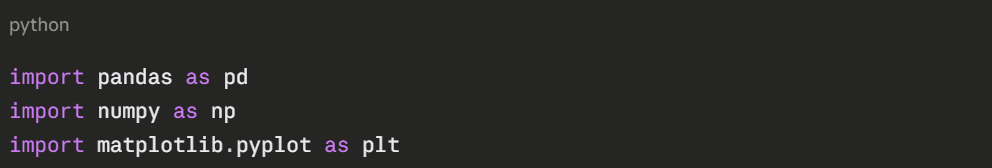
1. Import Libraries
Begin by loading the tools you'll need:
2. Load Data
Read data from files into a Pandas DataFrame:
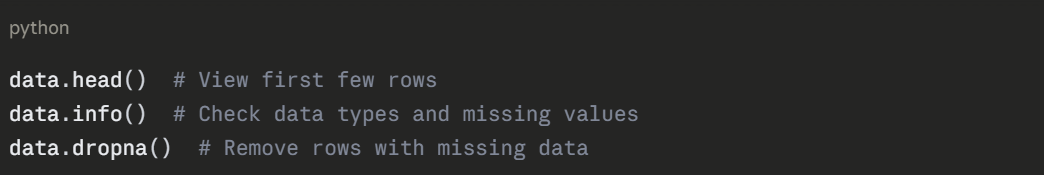
3. Explore and Clean
Inspect your data, handle missing values, and prepare it for analysis:
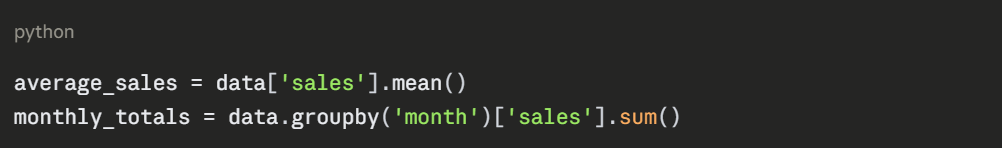
4. Analyze
Perform calculations, create summaries, and answer questions:
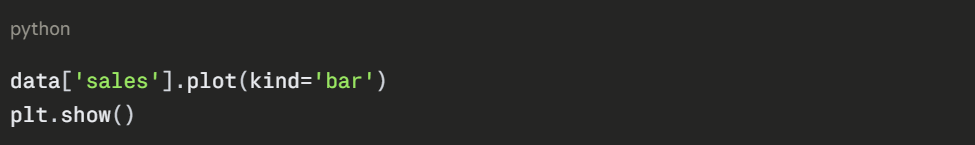
5. Visualize
Create charts to communicate findings:
This workflow demonstrates Python's straightforward approach—each step uses clear, readable commands that accomplish complex tasks efficiently.
Advantages Over Other Tools
Compared to Excel
1. Handles datasets with millions of rows without performance issues.
2. Provides reproducible analysis through code scripts.
3. Automates repetitive tasks easily.
4. Performs advanced statistical analysis beyond basic formulas.
Compared to R
1. Easier learning curve for programming beginners.
2. Better integration with web applications and production systems.
3. Wider applicability beyond statistics.
4. More unified syntax across libraries.
Compared to SQL
1. Offers comprehensive analysis capabilities beyond queries.
2. Includes built-in visualization tools.
3. Handles complex data transformations more flexibly.
4. Works with various data formats, not just databases.
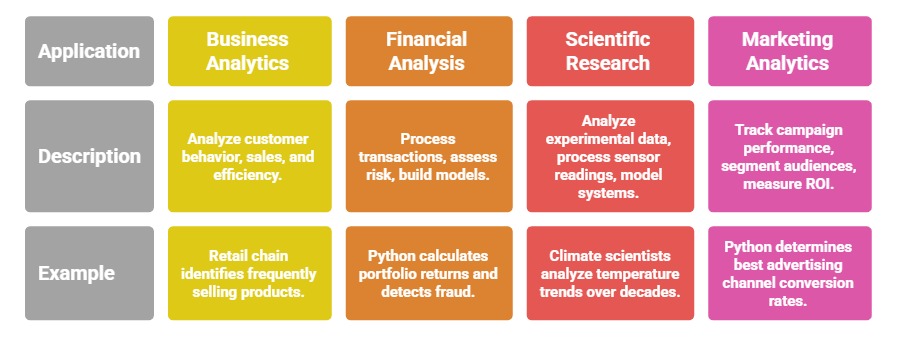
Real-World Applications
Python's versatility makes it valuable across industries:

Class Sessions
Sales Campaign

We have a sales campaign on our promoted courses and products. You can purchase 1 products at a discounted price up to 15% discount.