Every decision made under uncertainty , whether in business, medicine, finance, or everyday life is fundamentally rooted in probability.
As a data analyst, you will constantly work with data that is incomplete, sampled, or inherently unpredictable. Probability is the mathematical framework that allows you to reason about uncertainty in a structured and quantifiable way.
It answers questions like: "How likely is a customer to churn?", "What is the chance this transaction is fraudulent?", or "How probable is it that sales will exceed the target next month?" Understanding probability basics is not just a theoretical exercise, it is the foundation upon which statistical inference, machine learning, and data-driven decision making are all built.
What is Probability?
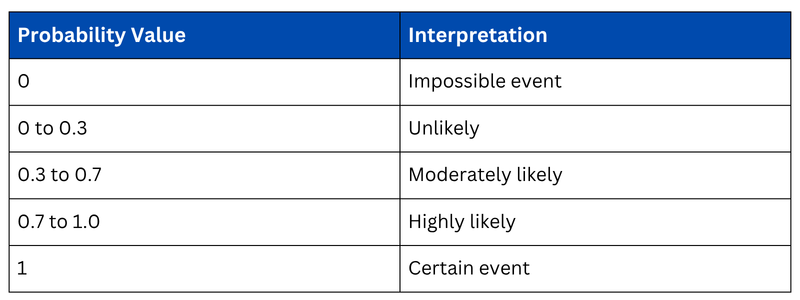
Probability is a numerical measure of how likely an event is to occur. It is always expressed as a value between 0 and 1, where 0 means the event will definitely not occur and 1 means it will definitely occur.

For example, the probability of rolling a 3 on a fair six-sided die:

Key Probability Terminology
Before going further, it is important to understand the core vocabulary used in probability.
1. Experiment: Any process or action that produces an observable outcome (e.g., flipping a coin, rolling a die).
2. Outcome: A single possible result of an experiment (e.g., getting Heads).
3. Sample Space (S): The complete set of all possible outcomes (e.g., {Heads, Tails} for a coin flip).
4. Event: A specific subset of outcomes from the sample space (e.g., getting an even number when rolling a die).
5. Complement: The probability that an event does NOT occur. If P(A) = 0.3, then P(A') = 1 - 0.3 = 0.7.
![]()
Types of Events
Not all events interact with each other the same way. Understanding how events relate determines which probability rules apply.
1. Independent Events: Two events where the outcome of one has absolutely no effect on the outcome of the other. Flipping a coin twice is a classic example — the result of the first flip has no influence on the second.
P(A and B)=P(A)×P(B)
P(A or B)=P(A)+P(B)
3. Non-Mutually Exclusive Events: Events that can occur simultaneously. Drawing a card that is both red and a King is possible, so you must subtract the overlap to avoid double-counting.
P(A or B)=P(A)+P(B)−P(A and B)
Conditional Probability
Conditional probability measures the likelihood of an event occurring given that another event has already occurred. It is one of the most practically useful concepts in data analysis — used in everything from spam filters to medical diagnosis.

This reads as: "The probability of A, given that B has already happened."
Probability Distributions — How Data Behaves
A probability distribution describes how probabilities are spread across all possible outcomes of a variable. It is the bridge between probability theory and real-world data analysis.
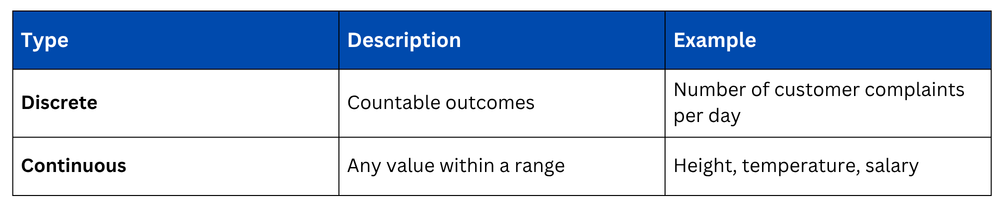
Discrete vs. Continuous Distributions
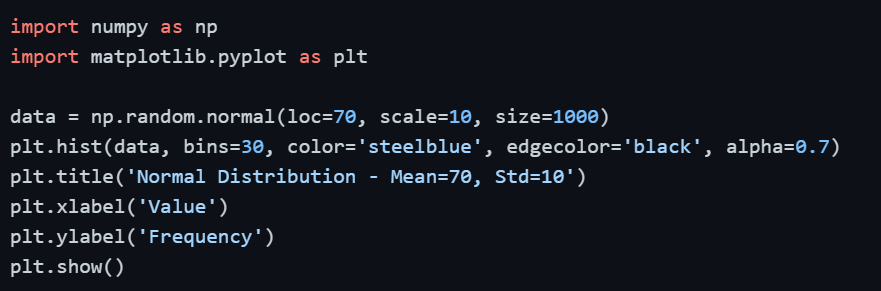
The Normal Distribution is the most important probability distribution in data analysis. It is the familiar bell-shaped curve where data clusters symmetrically around the mean, and the Empirical Rule (68-95-99.7%) applies directly.
The Binomial Distribution applies when you have a fixed number of trials, each with only two possible outcomes (success or failure) — such as whether a customer buys or not, or whether an email is opened or not.


Simulating Probability in Python
Python makes it straightforward to simulate and calculate probabilities, which is extremely useful for validating theoretical results against real observed data.

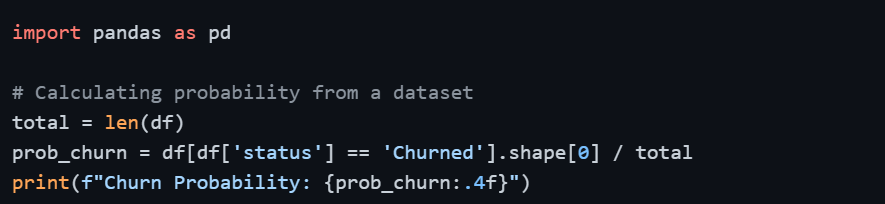
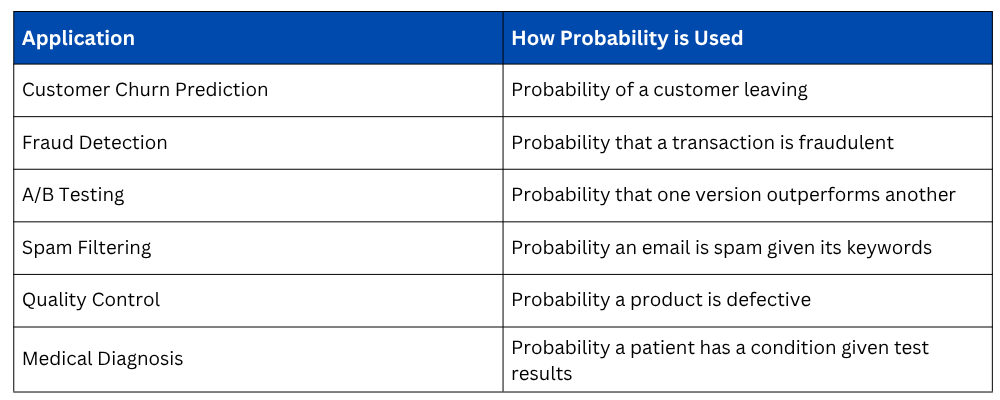
Probability in Data Analysis — Practical Relevance
Probability is not just a theoretical concept, it appears directly in many everyday data analysis tasks.

Class Sessions
Sales Campaign

We have a sales campaign on our promoted courses and products. You can purchase 1 products at a discounted price up to 15% discount.