Matplotlib is the foundational data visualization library in Python. Released in 2003 by John D. Hunter, it was originally designed to mimic the plotting capabilities of MATLAB, but has since grown into one of the most widely used and flexible charting libraries in the entire Python ecosystem.
Almost every other Python visualization library, including Seaborn and Pandas' built-in plotting is built on top of Matplotlib, which makes understanding it a critical first step before moving to higher-level tools.
What is Matplotlib
Matplotlib is an open-source Python library used to create static, animated, and interactive visualizations. It gives you complete control over every element of a chart — from axis labels and colors to tick marks and figure size.
Whether you need a simple line chart or a complex multi-panel figure, Matplotlib provides the tools to build it.
The most commonly used module within Matplotlib is pyplot, which provides a simple, MATLAB-style interface for creating plots quickly.

This single import is the standard starting point for almost every visualization you will create with Matplotlib.
The Anatomy of a Matplotlib Figure
Before writing any code, it helps to understand the structure of a Matplotlib chart, because its terminology appears repeatedly in documentation and real projects.
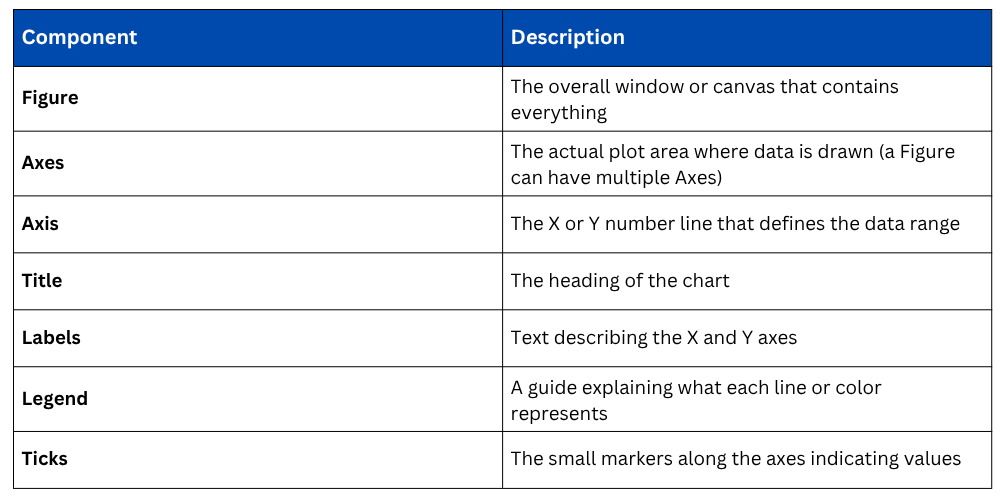
Think of the Figure as a blank canvas and the Axes as the frame where the actual drawing happens. This distinction becomes important when you start creating multi-chart layouts.
Two Ways to Use Matplotlib
Matplotlib offers two approaches to building plots, and both are widely used in practice.
1. pyplot Interface (Quick and Simple)
The pyplot interface is the most beginner-friendly approach. It manages figures and axes automatically behind the scenes, making it ideal for fast, exploratory visualizations.
.png)
2. Object-Oriented Interface (Recommended for Real Projects)
The object-oriented approach gives you explicit control over each Figure and Axes object. It is the preferred method for complex, multi-plot layouts and production-level work.
.png)
Both approaches produce the same output. For simple, one-off exploratory plots, pyplot is perfectly fine. For anything more structured or reusable, the object-oriented approach is the better habit to build.
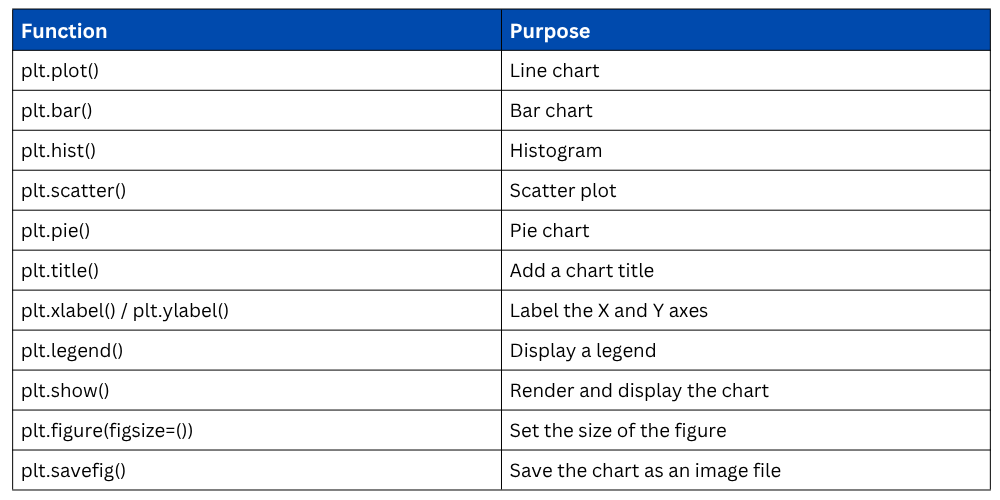
Commonly Used Matplotlib Functions
These are the core functions you will use repeatedly throughout your data analysis work.
Setting Figure Size
By default, Matplotlib produces relatively small figures. You can control the size using the figsize parameter, which accepts width and height in inches.

Adjusting figure size is a simple but important step, especially when charts are being exported for reports or presentations.
Saving a Plot
Instead of just displaying a chart, you can save it directly to a file using savefig(). Supported formats include PNG, JPG, and PDF.

The dpi parameter controls image resolution, and bbox_inches="tight" ensures the chart is not cut off at the edges.
Working with Matplotlib in Jupyter Notebook
When using Jupyter Notebook, adding the following line ensures that charts appear inline within the notebook rather than opening in a separate window.

This is typically placed once at the top of your notebook alongside your imports.

Class Sessions
Sales Campaign

We have a sales campaign on our promoted courses and products. You can purchase 1 products at a discounted price up to 15% discount.