One of NumPy's greatest strengths is its extensive library of built-in mathematical and statistical functions that operate directly on arrays efficiently and without loops.
Whether you are computing the average sales figure, finding the maximum temperature in a dataset, or applying a mathematical transformation to thousands of values at once, NumPy handles it all cleanly and quickly.
Mathematical Functions
NumPy mathematical functions are called universal functions (ufuncs) — they apply element-wise across the entire array, making them fast and concise to use.
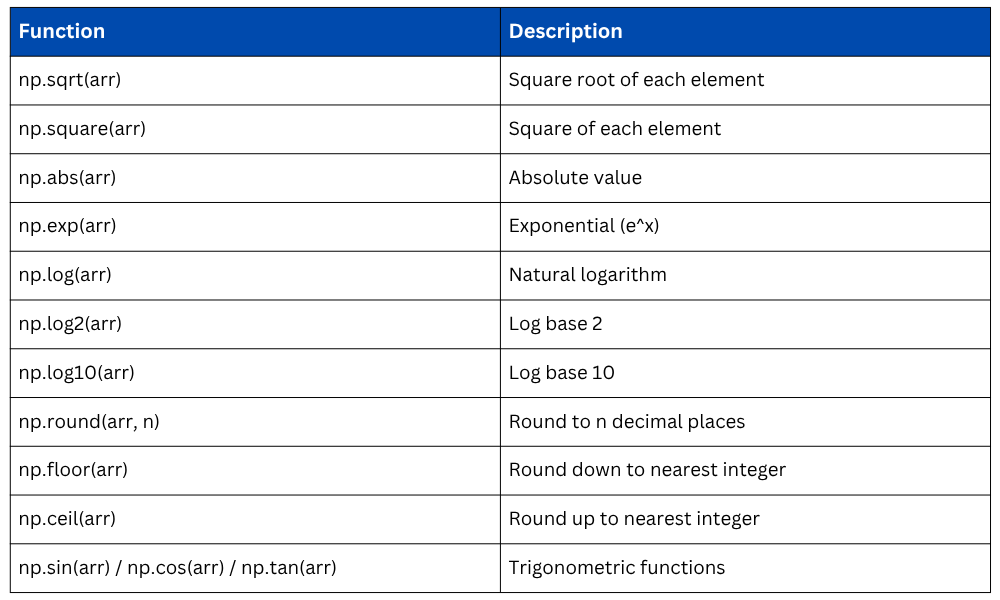
Basic Math Operations
These functions perform standard mathematical transformations on every element in an array simultaneously.
import numpy as np
arr = np.array([1, 4, 9, 16, 25])
print(np.sqrt(arr)) # Output: [1. 2. 3. 4. 5.] — square root
print(np.square(arr)) # Output: [ 1 16 81 256 625] — square
print(np.abs(np.array([-3, -1, 2, -5]))) # Output: [3 1 2 5] — absolute value
print(np.cbrt(arr)) # Output: cube root of each element
Exponential and Logarithmic Functions
These are widely used in data normalization, scaling, and statistical modeling.
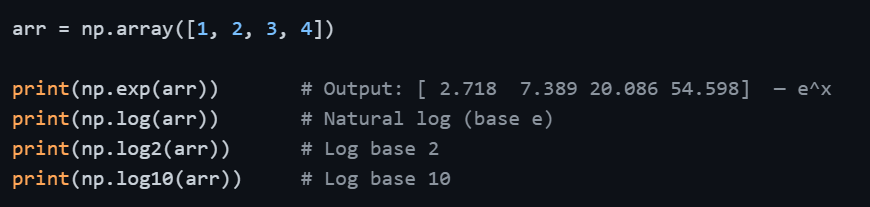
A practical note: np.log() computes the natural logarithm (base e). If your analysis requires a different base, use np.log2() or np.log10() accordingly.
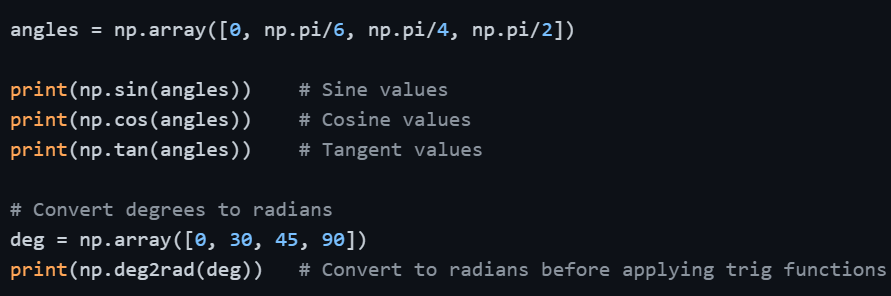
Trigonometric Functions
Useful in signal processing, physics-based data, and angular calculations. NumPy works in radians by default.
Rounding Functions
These functions are helpful when you need to control decimal precision in results.
arr = np.array([1.234, 2.567, 3.891, 4.105])
print(np.round(arr, 2)) # Output: [1.23 2.57 3.89 4.1 ] — round to 2 decimals
print(np.floor(arr)) # Output: [1. 2. 3. 4.] — round down
print(np.ceil(arr)) # Output: [2. 3. 4. 5.] — round up
print(np.trunc(arr)) # Output: [1. 2. 3. 4.] — remove decimals
Mathematical Functions
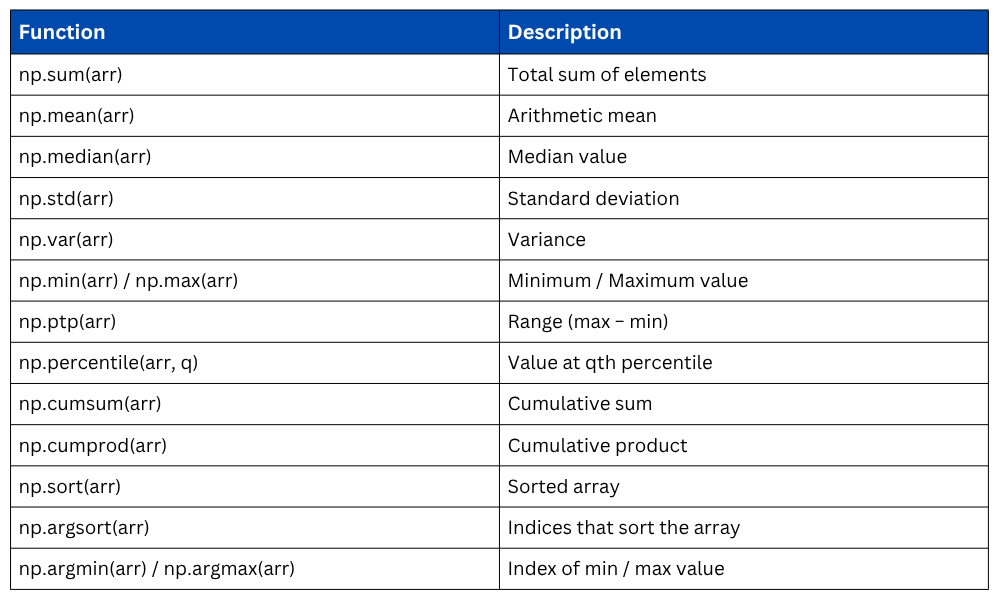
Statistical Functions
Statistical functions in NumPy allow you to summarize and understand your data quickly. These functions form the core of Exploratory Data Analysis (EDA) and are the building blocks behind Pandas' own statistical methods.
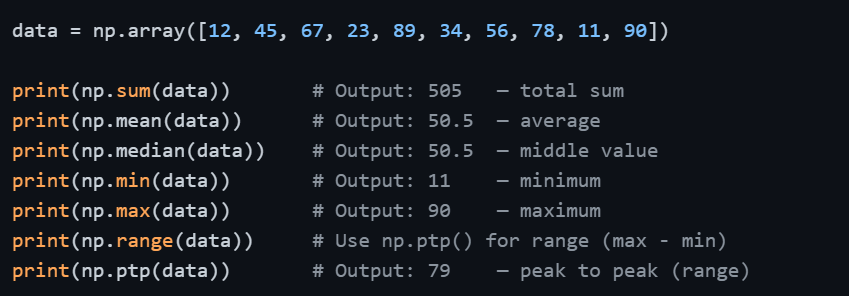
Descriptive Statistics
These are the most frequently used functions in data analysis, they give you an immediate snapshot of your dataset.
Variance and Standard Deviation
These functions measure how spread out the data is around the mean. A low standard deviation means values are close to the mean; a high one means they are widely spread.
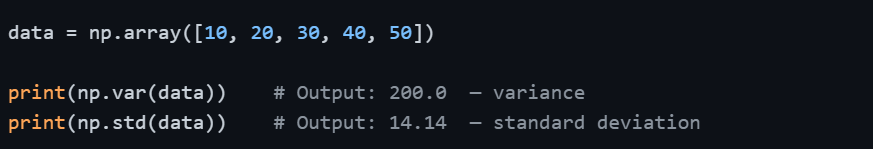
By default, NumPy computes population variance and standard deviation. If you are working with a sample and need sample statistics, pass ddof=1.

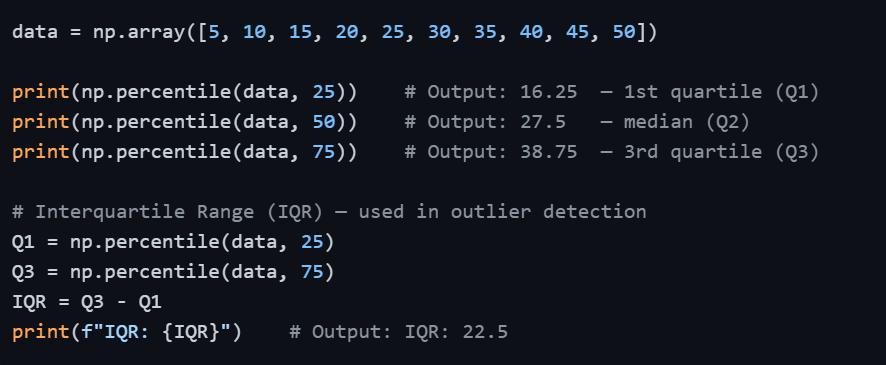
Percentiles and Quantiles
Percentiles tell you the value below which a given percentage of data falls. This is essential in understanding data distribution and detecting outliers.
Axis-Based Statistics for 2D Arrays
When working with 2D data, such as a table of values — you often need statistics computed per row or per column rather than across the entire array.
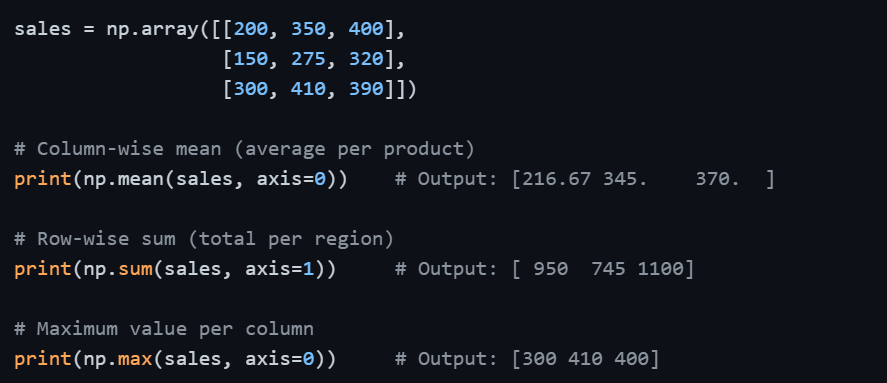
Remembering the axis direction — axis=0 works down rows (column-wise) and axis=1 works across columns (row-wise) — will save you from common mistakes when analyzing tabular data.
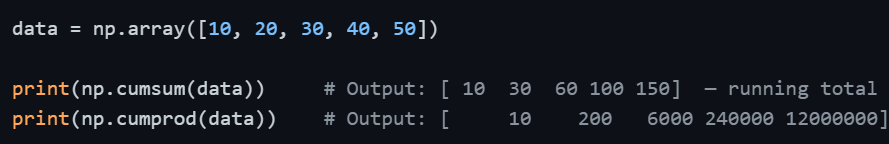
Cumulative Functions
Cumulative functions compute running totals or running products, useful in financial data and time-series analysis.
Sorting and Ordering
NumPy also provides functions to sort arrays and retrieve the positions of sorted or extreme values, useful when you need ranked data.
data = np.array([42, 15, 78, 23, 56])
print(np.sort(data)) # Output: [15 23 42 56 78] — sorted values
print(np.argsort(data)) # Output: [1 3 0 4 2] — indices that would sort array
print(np.argmin(data)) # Output: 1 — index of minimum value
print(np.argmax(data)) # Output: 2 — index of maximum value
argsort() is particularly useful when you want to sort one array based on the order of another, a common requirement in data analysis.
Statistical Functions
Putting It All Together — Real-World Example
Consider a scenario where you have monthly revenue data and need a quick analytical summary.
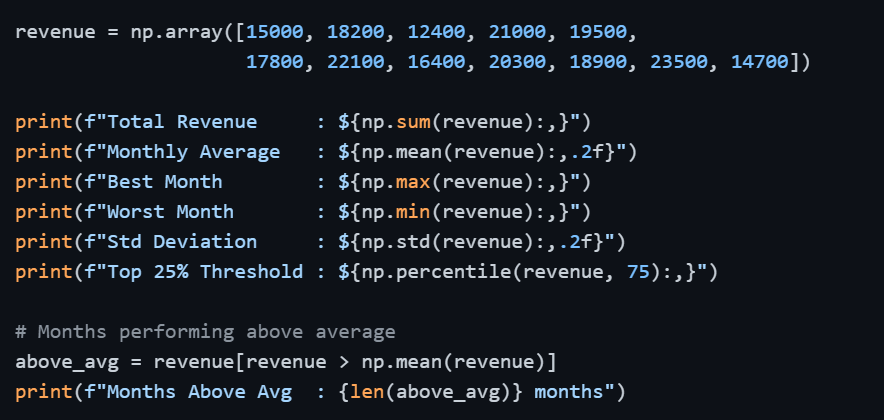
This compact block of code delivers a complete business summary, something that would take significantly more effort using plain Python.
