As machine learning models become increasingly sophisticated—ranging from deep neural networks to ensemble architectures their decision-making often turns into a “black box.”
This opacity creates risks around trust, accountability, compliance, and adoption in real-world systems.
Explainable AI (XAI) focuses on developing frameworks, algorithms, and tools that offer clarity on how predictions are produced, enabling users to inspect, diagnose, and validate model reasoning.
Interpretable machine learning complements this by emphasizing transparent models that are inherently understandable, such as linear models, rule-based engines, and monotonic predictors.
These methodologies have become crucial across sensitive domains like finance, healthcare, insurance, and justice systems, where auditability and justification are mandatory.
Modern XAI techniques—such as SHAP, LIME, counterfactual explanations, and attribution maps allow practitioners to uncover feature contributions, detect spurious correlations, and mitigate bias.
Interpretable ML models, meanwhile, prioritize simplicity without compromising too much predictive strength, making them ideal for high-stakes operations where clarity is a legal requirement.
Their combined strength ensures that AI systems operate reliably, transparently, and ethically.
SHAP (Shapley Additive Explanations)
1. SHAP computes the contribution of each input feature by treating the model as a cooperative game, distributing the “prediction value” among all features fairly.
2. It creates globally and locally consistent explanations, helping practitioners understand both individual predictions and overall patterns.
3. SHAP’s additive nature makes comparisons across models meaningful, revealing how features interact or shift importance over time.
4. It is invaluable for regulated industries, where explicit justification is mandatory for decisions such as loan approvals or fraud detection.
5. SHAP summary plots and force plots reveal subtle dependencies and non-linear effects that remain hidden in raw model outputs.
Example: A credit scoring model may show that “credit utilization” contributed +0.31 to a customer’s risk score, while “timely repayment history” reduced risk by −0.45.
LIME (Local Interpretable Model-Agnostic Explanations)
1. LIME provides local explanations by generating perturbed samples around a given instance and approximating the model behavior with a simpler surrogate model.
2. It is particularly effective for text and image data, giving insights into why certain phrases or regions influence classification.
3. The method highlights only the most influential components, enabling quick detection of anomalies or unexpected model logic.
4. LIME helps debug misclassifications and identify dataset deficiencies, especially in prototype development stages.
Example: For an email spam classifier, LIME may reveal that words like “free,” “prize,” or “urgent” strongly triggered a spam label.
Counterfactual Explanations
1. Counterfactuals illustrate how small changes in input could lead to a different outcome, offering highly actionable insights for users.
2. They are widely used in systems where stakeholders require clear remediation steps—such as improving credit eligibility or risk metrics.
3. The technique encourages models to remain fair and actionable, as it avoids opaque reasoning and instead focuses on directional guidance.
4. Counterfactuals can reveal hidden biases, showing if unfair or irrelevant features influence decisions.
Example: “If your annual income increased by ₹1.2 lakh and your credit utilization dropped by 5%, your loan would be approved.”
Interpretable Models (Linear, Rule-Based, Generalized Additive Models)
1. These models prioritize clarity by ensuring every parameter, rule, or function is directly understandable to humans.
2. They are widely used for risk management, clinical decision-making, and industrial monitoring where traceability is essential.
3. Rule-based systems generate explicit IF–THEN structures that mirror human reasoning, making training and validation intuitive.
4. Generalized Additive Models (GAMs) can capture nonlinear patterns while still offering interpretable curve-based insights.
Example: A hospital triage system using GAMs can show precisely how age, oxygen levels, and comorbidities affect severity scores.
Challenges & Limitations of XAI and Interpretable ML
Explainable AI (XAI) and interpretable machine learning aim to make complex models understandable to humans, fostering trust and accountability.
However, these approaches face challenges related to accuracy trade-offs, explanation consistency, computational costs, and potential misuse of insights.
1. Trade-off Between Accuracy and Transparency
Complex models such as transformers or deep neural networks often deliver top-tier accuracy but are difficult to interpret.
Choosing simpler interpretable models can reduce performance in high-dimensional or nonlinear tasks.
This creates continuous tension between clarity and predictive strength, especially in competitive domains like fraud detection and medical imaging.
2. Inconsistent Explanations Across Methods
Different explanation techniques (LIME, SHAP, Integrated Gradients, etc.) may highlight conflicting feature importance scores.
These discrepancies make it challenging for practitioners to determine which explanation reflects the “true” model behavior, raising reliability concerns in critical applications.
3. Explanation Stability Issues
Small changes in input data or model parameters may drastically alter explanations.
This instability can undermine user trust and makes regulatory validation difficult, particularly in industries like insurance underwriting or criminal risk scoring.
4. Computational Overhead for Large Models
Methods like SHAP can be computationally expensive, especially when deployed on large-scale deep learning systems or real-time decision engines.
High latency can prevent explanations from being delivered instantly to users.
5. Risk of Oversimplified Interpretations
Surrogate models used for explanation may hide nuanced interactions or oversimplify complex reasoning.
This could lead stakeholders to misunderstand model logic, causing flawed decisions.
6. Potential Leakage of Sensitive Information
XAI techniques that reveal feature importance or decision pathways may unintentionally expose sensitive correlations or proprietary modeling logic.
This poses compliance and intellectual property risks.
7. Lack of Universal Evaluation Metrics
There is no industry-standard benchmark to measure the “quality” of an explanation.
Without standardized metrics, it's difficult to validate or compare the trustworthiness of explanations across systems.
Best Practices for Implementing Explainable AI (XAI)
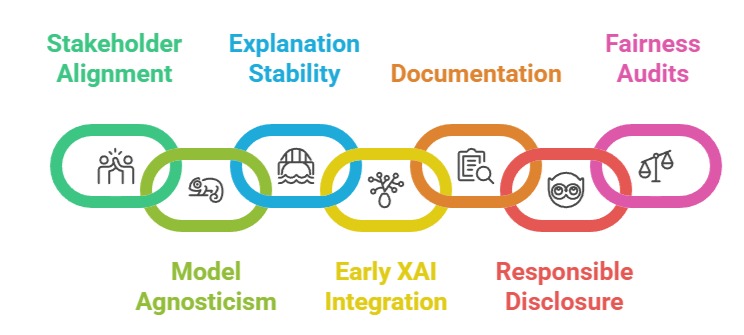
1. Align Explanations With Stakeholder Needs
Design explanation interfaces for specific audiences—data scientists, regulators, doctors, customers, or managers.
Technical users may require detailed feature attributions, while end-users may need simplified narratives.
2. Use Model-Agnostic and Model-Specific Techniques Together
Combining methods like SHAP (global + local) with rule-based summaries or attention visualization provides a more holistic and reliable perspective of model behavior.
3. Validate Explanation Stability
Run multiple rounds of perturbation, retraining, and sampling to verify whether explanations remain consistent. Stable reasoning builds trust and ensures reliability in deployment.
4. Integrate XAI Early in the ML Pipeline
Incorporate explainability during data exploration, feature engineering, and model selection not just after deployment. This prevents hidden biases and enhances auditability from day one.
5. Document Every Decision-Making Component
Maintain version-controlled logs of datasets, hyperparameters, and explanation outputs. This is crucial for legal auditing, fairness reviews, and debugging model drift.
6. Apply Responsible Disclosure for Sensitive Insights
Avoid exposing proprietary logic or correlations that could be misused. Provide explanations that are ethical, secure, and privacy-compliant.
7. Combine Interpretability With Fairness Audits
Regularly assess disparate feature impact, counterfactual fairness, and inequality across demographic groups. XAI insights should guide bias mitigation strategies.

Class Sessions
Sales Campaign

We have a sales campaign on our promoted courses and products. You can purchase 1 products at a discounted price up to 15% discount.