Monitoring performance with Power BI's Performance Analyzer is a vital practice to optimize reports for speed and efficiency.
Performance Analyzer is a built-in tool in Power BI Desktop that helps report developers identify bottlenecks by capturing detailed timing information about each visual’s query, DAX evaluation, and rendering process.
Understanding how each component contributes to overall report load times enables targeted optimizations that improve user experience, especially when working with large datasets or complex calculations.
This continuous performance monitoring supports iterative improvement to keep reports responsive and scalable.
Performance Analyzer provides actionable insights by breaking down report rendering into query duration (the time taken to retrieve data), visual display time, and DAX formula evaluation.
Developers can export this data for deeper analysis, compare performance before and after changes, and pinpoint inefficient visuals or measures.
By combining these insights with best practices like query reduction, data model optimization, and careful visual design, Power BI users can deliver fast, intuitive reports that meet business needs without compromising on analytical richness.
Key Features of Performance Analyzer
To build responsive and efficient reports, it is essential to understand performance drivers. The main features listed below explain how Performance Analyzer evaluates visuals and queries.
1. Visual Breakdown: Displays times spent on query execution, DAX calculation, and visual display for each report element.
2. Record and Export: Allows recording performance sessions and exporting results as JSON or CSV for analysis.
3. Identify Bottlenecks: Helps detect visuals or DAX expressions causing slowdowns.
4. Real-Time Feedback: Enables live performance review during report development.
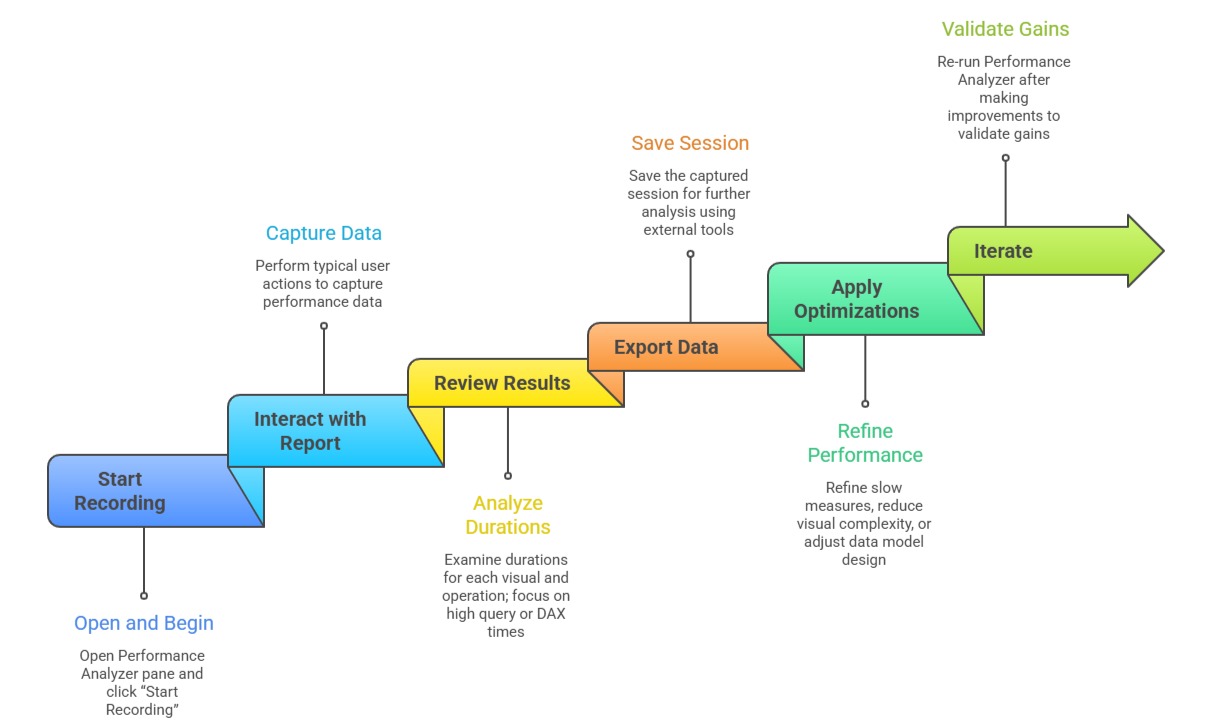
Using Performance Analyzer Effectively
Using Performance Analyzer effectively requires a structured and repeatable approach. The main steps listed below guide you through recording, reviewing, and improving report performance.
Best Practices for Improved Performance
Improving performance requires thoughtful design across the entire Power BI solution. The key strategies below explain how to streamline data processing and visualization.
1. Prefer aggregated data sources and pre-aggregated tables.
2. Simplify complex DAX calculations and reuse variables.
3. Limit visuals per report page and avoid heavy custom visuals if possible.
4. Use query folding in Power Query to push transformations to the data source.
5. Optimize relationships and cardinality to reduce data scanning.
