Creating Query Parameters and Templates in Power BI is an advanced technique that enhances report flexibility, reusability, and user interactivity.
Query parameters act as dynamic placeholders within Power Query, allowing users to input variable values such as file paths, filter criteria, or connection details.
This functionality enables the design of adaptable queries that can change based on user input, simplifying the maintenance of reports and enabling automation.
Templates leverage these parameters by packaging the structure of a Power BI report—including queries, data models, and reports—without embedding the actual data, allowing users to generate customized reports by providing different parameter values during template instantiation.
Creating Query Parameters
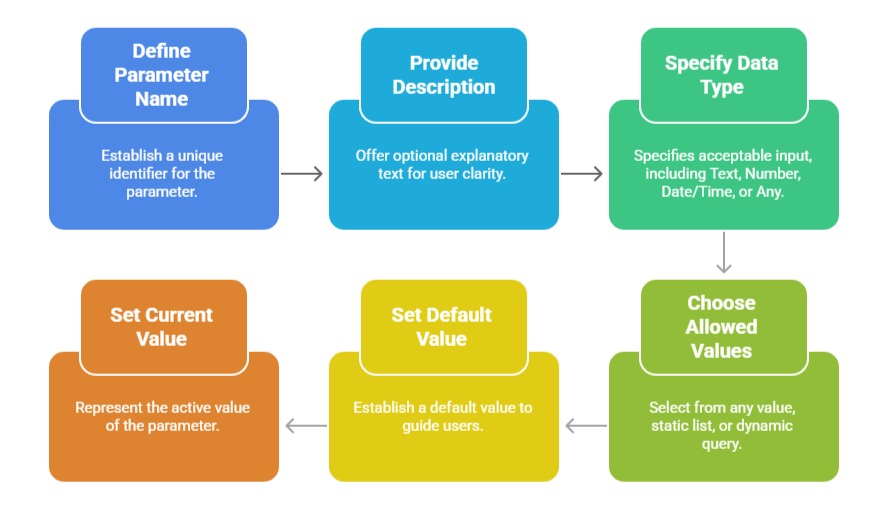
In practice, query parameters are created within the Power Query Editor via the "Manage Parameters" dialog. Parameters can be configured with metadata such as name, description, data type (text, number, date/time), and restrictions on acceptable values (static lists or any value).
Once created, parameters behave like any other query and can be referenced within data source connections, applied filters, conditional columns, or calculations.
1. Accessing Parameters: In Power Query Editor, click Home > Manage Parameters > New Parameter.
2. Define Parameter Details:
 3. Using Parameters in Queries:
Replace static values like file paths or filter values with parameter references.
Use parameters inside filter rows, replace values, or conditional columns.
Reference parameters in custom M expressions for more advanced query logic.
4. Loading Parameters: By default, parameters are not loaded into the data model but can be enabled if needed.
Creating and Using Power BI Templates
Templates save report definitions without data, allowing users to create new reports by supplying parameter values.
1. Exporting Templates: Select File > Export > Power BI Template (.pbit) in Power BI Desktop.
2. Using Templates: Opening a template file prompts users to enter or select parameter values, creating a new PBIX file populated with data according to those parameters.
Benefits: Facilitates report reuse, standardization, and deployment across environments or user groups without duplicating work.
For example, a user can create a parameter to hold a database server name or a country filter and reference it in queries, making it easy to switch data sources or focus on different data slices without modifying query code.
Templates (.pbit files) can be exported from Power BI Desktop to include these parameters, prompting users for input values on opening, dynamically generating tailored reports without duplicating effort.
Use Cases and Benefits

