Creating and managing relationships between tables is a fundamental aspect of effective data modeling in Power BI.
Relationships enable tables within a data model to communicate with each other by connecting keys, allowing for integrated analyses across diverse datasets.
Proper relationship design ensures that data is accurately aggregated and filtered in reports, facilitating meaningful insights and seamless interaction when slicing and dicing data through visuals.
Types of Relationships in Power BI
In Power BI, relationships are typically established between a primary or unique key column in one table (often called the "one" side) and a foreign key column in another table (the "many" side).
These relationships can be one-to-one, one-to-many, or many-to-many, depending on the underlying data structure.
1. One-to-Many (1:*)
The most common relationship type, where one record in the primary table relates to multiple records in the related table.
Example: A single customer (dimension) has many sales transactions (fact).
2. One-to-One (1:1)
Less common, where one record in one table relates to exactly one record in another table.
Useful when splitting datasets for security or organizational purposes.
3. Many-to-Many (:)
Used when multiple records in one table relate to multiple records in another without a straightforward key.
Requires careful handling with bridging tables or composite models to avoid ambiguous results.
Creating Relationships in Power BI
Power BI automatically detects relationships based on matching column names and data types, but users can create, edit, or delete relationships manually to ensure accuracy.
Defining the correct cardinality and relationship direction is crucial for the desired data filtering behavior and performance.
1. Automatic Relationship Detection: Power BI automatically detects relationships during data load by analyzing column names and data types. These relationships can be reviewed, edited, or removed to ensure the data model aligns with reporting requirements.
2. Manual Relationship Creation: Users can manually create relationships in the Model view by dragging fields between tables or using the Manage Relationships dialog. This allows precise control over related tables, columns, relationship cardinality, and cross-filter behavior.
3. Configuring Cross-Filter Direction: Cross-filter direction controls how filters propagate between related tables. Single-direction filtering is preferred for simplicity and performance, while bi-directional filtering supports complex models but may impact clarity and efficiency.
4. Active vs Inactive Relationships: Power BI allows multiple relationships between the same tables, though only one can be active at a time. Inactive relationships can still be leveraged dynamically within DAX calculations using the USERELATIONSHIP function.
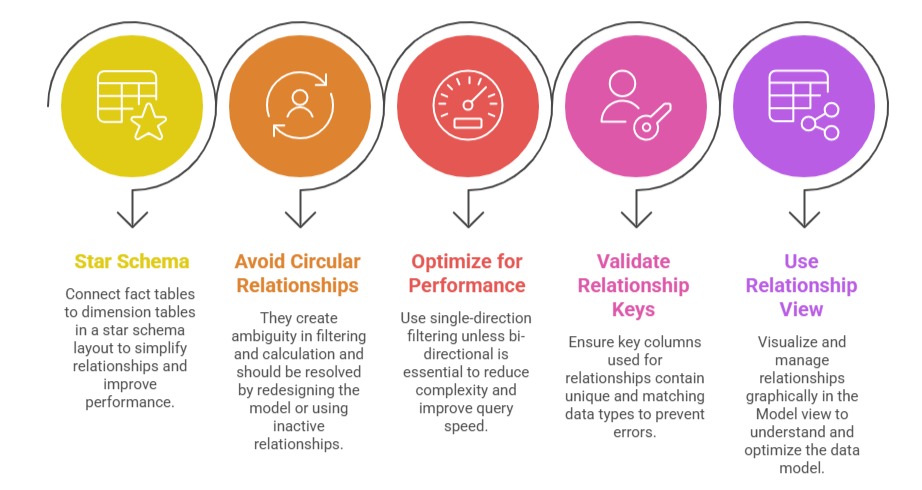
Managing Relationships Best Practices
 Impact of Relationships on Data Analysis
1. Enable slicing and filtering across tables in reports, allowing users to drill down into details.
2. Support complex DAX calculations involving related tables and aggregated context.
3. Facilitate hierarchical drill-downs for time, geography, and product categories.
4. Prevent data duplication or incorrect aggregations by correctly relating granular and summarized data.

Class Sessions
Sales Campaign

We have a sales campaign on our promoted courses and products. You can purchase 1 products at a discounted price up to 15% discount.