Optimizing DAX for performance is crucial for building efficient, responsive, and scalable Power BI reports.
As DAX calculations drive dynamic aggregations and analytics in Power BI, poorly optimized formulas can significantly impact query speed, report refresh times, and overall user experience.
Performance tuning ensures that data models and reports run smoothly, even with large datasets and complex business logic, enabling quicker insights and better decision-making.
Effective DAX optimization involves understanding how calculations interact with data model structure, filter contexts, and underlying engine processing.
It requires strategic use of functions, minimizing resource-intensive operations, and leveraging Power BI’s advanced tools for diagnosing and improving performance.
Core Principles for Optimizing DAX Performance
The main principles of DAX optimization focus on reducing computation overhead and improving efficiency. The list below outlines practical techniques to enhance calculation speed and scalability.
1. Minimize Row Context Iterations
Avoid unnecessary use of iterators like FILTER(), SUMX(), or ADDCOLUMNS() over large tables.
When possible, replace row-by-row operations with aggregated or set-based functions for efficiency.
2. Prefer Measures Over Calculated Columns
Measures are calculated dynamically and do not increase model size.
Calculated columns are static and consume memory, increasing refresh time.
3. Use Variables to Store Intermediate Results
Variables prevent repeated calculation of the same expression within a formula.
Simplify complex expressions by breaking them into reusable parts.
4. Filter Early and Narrow Data Scope
Apply filters as early as possible to reduce the dataset size processed in calculations.
Use CALCULATE() earlier in formulas with precise filters to optimize query plans.
5. Avoid Complex Nested Functions When Possible: Deeply nested or chained functions increase evaluation time. Break complex logic into multiple measures or variables.
6. Limit Use of ALL() and Remove Unnecessary Filters: While ALL() is powerful, overuse can force full table scans and degrade performance.
7. Optimize Relationships and Data Model Structure
Simplify relationships where feasible.
Use a star schema design to reduce join complexity.
8. Use Summary Tables and Aggregated Data: Pre-aggregate data at source or in Power Query to limit computation in DAX.
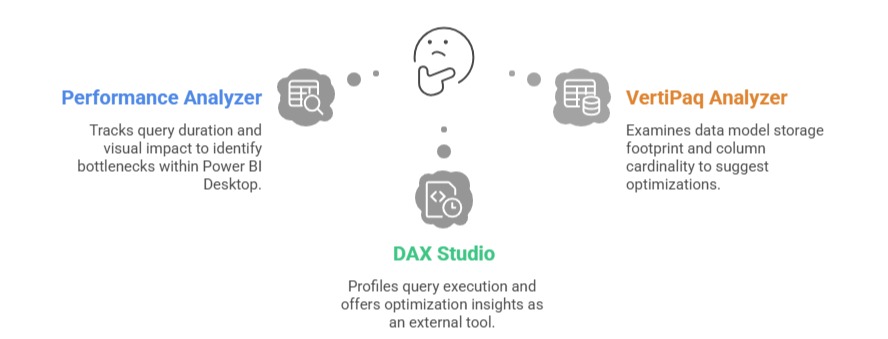
Diagnostic Tools and Techniques
Power BI provides built-in and external tools to diagnose performance challenges. Listed below are the key techniques used to evaluate and optimize reports and data models.
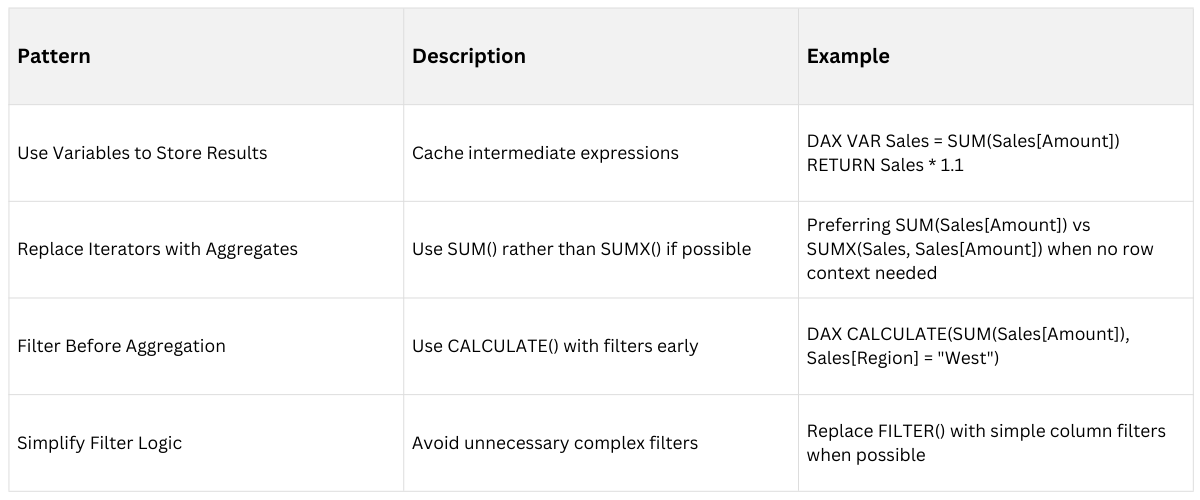
Common Optimization Patterns

Class Sessions
Sales Campaign

We have a sales campaign on our promoted courses and products. You can purchase 1 products at a discounted price up to 15% discount.