Calculated columns and measures are two fundamental types of calculations in Power BI that serve different analytical purposes and operate differently within the data model.
Both use Data Analysis Expressions (DAX) as their formula language, but understanding their distinctions is critical for designing efficient, accurate, and scalable BI reports.
Knowing when to use calculated columns versus measures directly impacts how data is stored, processed, and ultimately visualized, enhancing user experience and model performance.
Calculated columns are computed row-by-row during the data refresh or load process and stored as part of the data table itself. Each row in the table contains a fixed calculated value, making these columns behave like any other column in the model—they can be used for slicing, filtering, and relationships.
They occupy physical storage space, and their values are static until the dataset is refreshed. Calculated columns are ideal when the calculation needs to produce values for each row that can then be referenced independently across the model.
Measures, in contrast, are dynamic calculations computed on the fly during query time based on the current filter context applied in reports and visuals.
Measures do not consume additional storage because they are not stored as data columns but exist as DAX expressions evaluated each time they are used.
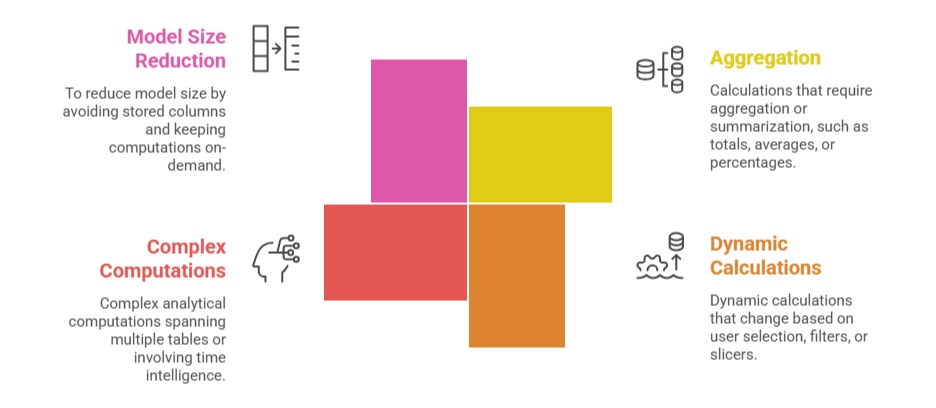
This allows measures to perform aggregations, summaries, or complex analytical computations that adjust dynamically with user interactions such as slicers or cross-filters.
Measures are essential for aggregations like sums, averages, counts, or more complex KPIs that rely on the visual context.
Key Differences Between Calculated Columns and Measures
 When to Use Calculated Columns
The key scenarios listed below explain when calculated columns are the most effective choice.
1. Need a value available in each row, such as derived categories or flags.
2. When computed values must be used in slicers, filters, or to create relationships.
3. Pre-calculating values to improve performance when repeated use is expected.
4. When data model changes are infrequent, as recalculation requires dataset refresh.
Example: Creating a “Sales Category” column based on sales amount ranges for segmenting data.
When to Use Measures
The list below highlights situations where measures provide flexible and context-aware results.
Example: Calculating total sales amount that changes as users apply filters on dates or regions.
Practical Implications
1. Measures offer flexibility and efficiency for dynamic reporting but cannot be used directly in filter controls or relationships.
2. Calculated columns add versatility by acting as regular columns but at the cost of increased model size and less flexibility.
3. Excessive use of calculated columns can bloat model size and slow down refresh times.
Best practice encourages maximizing the use of measures for calculations and using calculated columns only when the row-level value is needed for filtering or direct referencing.

Class Sessions
Sales Campaign

We have a sales campaign on our promoted courses and products. You can purchase 1 products at a discounted price up to 15% discount.