USD ($)
$
United States Dollar
Euro Member Countries
India Rupee

Publishing Reports to Power BI Service

Lesson 30/44 | Study Time: 20 Min

Publishing reports to Power BI Service is a critical step in transitioning from report creation to collaborative sharing and enterprise-wide insights delivery.

Power BI Service is the cloud-based platform where Power BI Desktop reports become accessible to users across an organization, enabling real-time data interaction, collaboration, and secure distribution.

Effective publishing goes beyond simply uploading a file; it involves organizing content within workspaces, managing permissions, scheduling data refreshes, and optimizing performance for seamless user experience.

When publishing, Power BI Desktop packages the data model and report visuals into a dataset-report pair uploaded to a selected workspace in the Power BI Service.

Workspaces act as collaborative environments allowing teams to co-manage content and access controls.

After publishing, reports can be shared directly or pinned to dashboards, embedded in apps or websites, and integrated with other Microsoft 365 tools like Teams and SharePoint.

Additionally, scheduling automatic dataset refreshes ensures users always see the latest data without manual intervention.

Steps for Publishing Reports to Power BI Service

Publishing reports allows organizations to share insights at scale and collaborate in real time. The list below outlines the key steps for making reports available, refreshed, and governed.


1. Prepare the Report


Ensure the report is complete, tested, and optimized for performance and usability.

Confirm data connections are accessible from the cloud environment.

Clean up naming, format visuals, and confirm filters.


2. Publish from Power BI Desktop


Click File > Publish > Publish to Power BI or select the Publish button from the Home ribbon.

Authenticate if prompted with Power BI account credentials.

Select the appropriate workspace (avoid “My Workspace” for collaboration).


3. Post-Publishing Actions


Open the report in the Power BI Service using the provided link.

Set up scheduled refresh, configuring on-premises gateways if needed.

Manage access permissions by assigning workspace roles (admin, member, contributor, viewer).

Pin report visuals to dashboards and create apps for wider distribution.


4. Collaboration and Sharing


Share reports securely with stakeholders either via the Service or by embedding.

Use Power BI apps to package reports and dashboards for distribution.

Enable comments and subscriptions for proactive engagement.

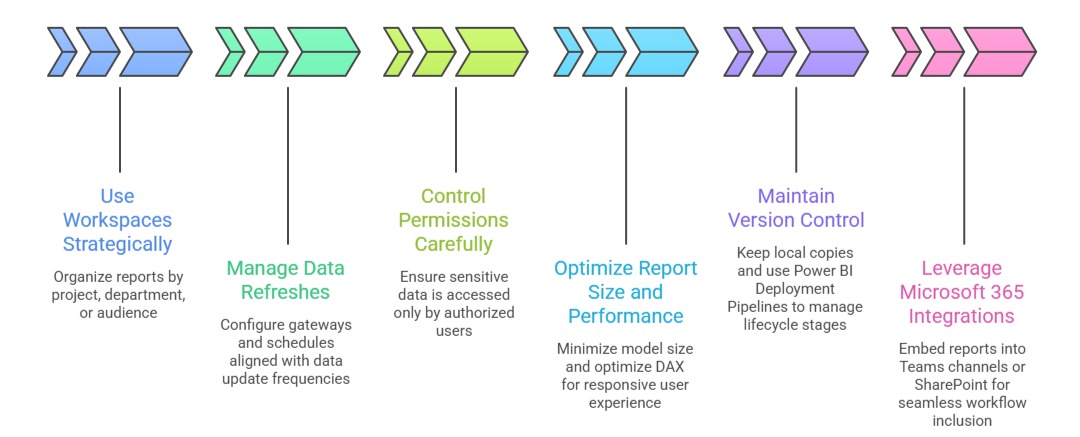
Best Practices for Publishing

Well-managed publishing practices improve collaboration and trust in analytics. The list below outlines key guidelines for delivering reliable and accessible insights.


1. Use Workspaces Strategically: Organize reports by project, department, or audience for better content management.

2. Manage Data Refreshes: Configure gateways and schedules aligned with data update frequencies.

3. Control Permissions Carefully: Ensure sensitive data is accessed only by authorized users.

4. Optimize Report Size and Performance: Minimize model size and optimize DAX for responsive user experience.

5. Maintain Version Control: Keep local copies and use Power BI Deployment Pipelines to manage lifecycle stages (Dev, Test, Prod).

6. Leverage Microsoft 365 Integrations: Embed reports into Teams channels or SharePoint for seamless workflow inclusion.

Ryan Cole

Ryan Cole

Product Designer
Profile

Class Sessions

1- Overview of Business Intelligence Concepts 2- Power BI Ecosystem and Components 3- Understanding Power BI Desktop, Service, and Mobile App 4- Data-Driven Decision Making Fundamentals 5- Connecting to Data Sources (SQL, Excel, Cloud, APIs) 6- Data Import vs Direct Query 7- Power Query Editor Basics and Advanced Transformations 8- Data Cleaning, Shaping, and Formatting 9- Creating Query Parameters and Templates 10- Principles of Data Modeling in Power BI 11- Star Schema and Snowflake Schema Concepts 12- Creating and Managing Relationships Between Tables 13- Calculated Columns vs Measures 14- Role of Lookup and Fact Tables in BI 15- DAX Fundamentals and Syntax 16- Calculated Columns and Measures in Depth 17- Aggregation and Filter Functions 18- Time Intelligence Calculations (YTD, MTD, QTD, etc.) 19- Context in DAX: Row Context and Filter Context 20- Using Variables and Advanced Calculation Techniques 21- Dynamic Calculations and What-If Analysis 22- Hierarchies and Drill-Down Techniques 23- Working with Parent-Child and Many-to-Many Relationships 24- Optimizing DAX for Performance 25- Principles of Effective Data Visualization 26- Creating Interactive Reports and Dashboards 27- Choosing the Right Visuals (Charts, KPIs, Maps, Tables) 28- Using Bookmarks, Tooltips, and Drillthroughs 29- Applying Conditional Formatting and Visual Level Filters 30- Publishing Reports to Power BI Service 31- Workspaces and Apps in Power BI 32- Sharing and Collaborating Securely with Row-Level Security (RLS) 33- Scheduled Refresh and Data Gateway Configuration 34- Usage Metrics and Report Usage Monitoring 35- Real-Time Data Streaming and Dashboards 36- Integration with Azure Synapse and Cognitive Services 37- AI Features in Power BI: Insights, Q&A, and Anomaly Detection 38- Using Power Automate with Power BI for Workflow Automation 39- Implementing Predictive Analytics and Forecasting 40- Best Practices for Data Model Optimization 41- Query Reduction and Load Optimization Techniques 42- Troubleshooting Common Power BI Issues 43- Monitoring Performance with Performance Analyzer 44- Governance and Compliance Considerations in Power BI

Sales Campaign

Sales Campaign

We have a sales campaign on our promoted courses and products. You can purchase 1 products at a discounted price up to 15% discount.