USD ($)
$
United States Dollar
Euro Member Countries
India Rupee

Overview of Business Intelligence Concepts

Lesson 1/44 | Study Time: 10 Min

Business Intelligence (BI) is the practice of collecting, analyzing, and transforming raw data into meaningful insights that support informed business decision-making.

At its core, BI enables organizations to gain a comprehensive understanding of their operations, customer behaviors, and market trends by leveraging data-driven analysis.

The process typically involves gathering data from multiple sources, cleaning and integrating it into a unified repository such as a data warehouse, and then analyzing and visualizing this data through various tools including dashboards and reports.

This approach helps businesses identify opportunities, improve efficiency, and respond proactively to challenges.

Modern BI is not limited to simple reporting; it encompasses advanced analytics techniques, such as data mining, performance benchmarking, and predictive modeling, to provide both descriptive (what happened) and prescriptive (what should be done) insights.

Key Concepts in Business Intelligence

Key components of a BI system include data integration, storage, analysis, and presentation layers, all supported by people and processes aligned to business goals.

BI allows businesses to make fact-based decisions, set effective benchmarks, track key performance indicators (KPIs), and continuously optimize their strategies in competitive environments.


1. Data Gathering: Collecting information from diverse internal systems (like ERP, CRM) and external sources (market data, social media).

2. Data Cleaning & Transformation: Preparing data by eliminating errors, formatting, and standardizing for consistency.

3. Data Storage: Centralizing data in warehouses or cloud platforms for efficient access.

4. Data Analysis & Mining: Using statistical and machine learning techniques to uncover hidden patterns and insights.

5. Reporting & Visualization: Presenting data in intuitive formats such as charts and dashboards for decision-makers.

6. Descriptive vs Predictive Analytics: Understanding past trends and forecasting future outcomes to guide strategy.

7. Performance Metrics & Benchmarking: Measuring progress against targets and industry standards.

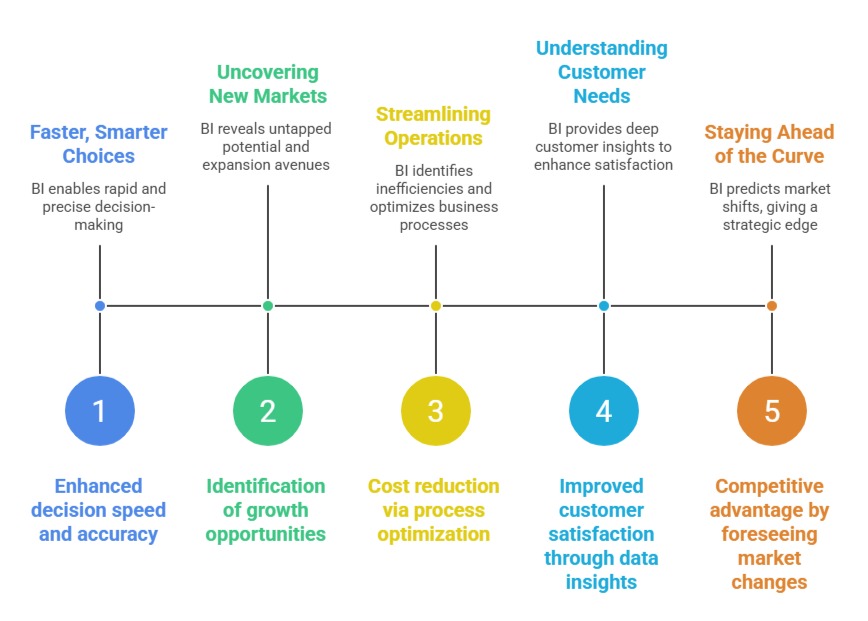
Benefits of Business Intelligence


1. Enhanced decision speed and accuracy

2. Identification of growth opportunities

3. Cost reduction via process optimization

4. Improved customer satisfaction through data insights

5. Competitive advantage by foreseeing market changes

Ryan Cole

Ryan Cole

Product Designer
Profile

Class Sessions

1- Overview of Business Intelligence Concepts 2- Power BI Ecosystem and Components 3- Understanding Power BI Desktop, Service, and Mobile App 4- Data-Driven Decision Making Fundamentals 5- Connecting to Data Sources (SQL, Excel, Cloud, APIs) 6- Data Import vs Direct Query 7- Power Query Editor Basics and Advanced Transformations 8- Data Cleaning, Shaping, and Formatting 9- Creating Query Parameters and Templates 10- Principles of Data Modeling in Power BI 11- Star Schema and Snowflake Schema Concepts 12- Creating and Managing Relationships Between Tables 13- Calculated Columns vs Measures 14- Role of Lookup and Fact Tables in BI 15- DAX Fundamentals and Syntax 16- Calculated Columns and Measures in Depth 17- Aggregation and Filter Functions 18- Time Intelligence Calculations (YTD, MTD, QTD, etc.) 19- Context in DAX: Row Context and Filter Context 20- Using Variables and Advanced Calculation Techniques 21- Dynamic Calculations and What-If Analysis 22- Hierarchies and Drill-Down Techniques 23- Working with Parent-Child and Many-to-Many Relationships 24- Optimizing DAX for Performance 25- Principles of Effective Data Visualization 26- Creating Interactive Reports and Dashboards 27- Choosing the Right Visuals (Charts, KPIs, Maps, Tables) 28- Using Bookmarks, Tooltips, and Drillthroughs 29- Applying Conditional Formatting and Visual Level Filters 30- Publishing Reports to Power BI Service 31- Workspaces and Apps in Power BI 32- Sharing and Collaborating Securely with Row-Level Security (RLS) 33- Scheduled Refresh and Data Gateway Configuration 34- Usage Metrics and Report Usage Monitoring 35- Real-Time Data Streaming and Dashboards 36- Integration with Azure Synapse and Cognitive Services 37- AI Features in Power BI: Insights, Q&A, and Anomaly Detection 38- Using Power Automate with Power BI for Workflow Automation 39- Implementing Predictive Analytics and Forecasting 40- Best Practices for Data Model Optimization 41- Query Reduction and Load Optimization Techniques 42- Troubleshooting Common Power BI Issues 43- Monitoring Performance with Performance Analyzer 44- Governance and Compliance Considerations in Power BI