USD ($)
$
United States Dollar
Euro Member Countries
India Rupee

Workspaces and Apps in Power BI

Lesson 31/44 | Study Time: 20 Min

Workspaces and apps in Power BI are fundamental elements for organizing, collaborating, and distributing BI content effectively across teams and organizations.

Workspaces serve as collaborative environments where multiple users can store, develop, and manage datasets, reports, dashboards, and dataflows.

They facilitate teamwork with role-based permissions, allowing content creators, contributors, and viewers to collaborate securely and efficiently.

Apps, on the other hand, are curated bundles of reports and dashboards published from workspaces to deliver a polished, user-friendly experience targeted at a wider audience, including business users and executives.

Together, workspaces and apps enhance governance, content lifecycle management, and security while ensuring that content distribution is scalable and controlled.

Proper use of workspaces supports the BI development lifecycle, from prototyping to production, while apps simplify content consumption, enabling users to access the right insights with consistent branding, navigation, and user experience.

Workspaces in Power BI

The purpose is to provide a shared environment for BI team collaboration and content management.


Types:


1. Personal Workspace ("My Workspace"): A private area for individual users to develop and test content.

2. App Workspaces: Used by teams or departments for collaborative creation and management of BI artifacts.


Roles and Permissions:


1. Admin: Full control over workspace and content.

2. Member: Can edit content and manage resources.

3. Contributor: Can add and edit content but cannot manage workspace settings.

4. Viewer: Read-only access to view content only.


Content Management: Store Power BI reports, datasets, dashboards, and dataflows; enable version control and content staging.

Apps in Power BI

The purpose is to deliver curated, production-quality collections of reports and dashboards to end users.


1. Creation: Published directly from app workspaces to create a read-only, branded experience.

2. Distribution: Apps can be shared via Microsoft 365 groups, email, or embedded in portals.


Benefits: Simplified navigation, centralized access, controlled access permissions, and consistent UX/UI design.

User Experience: Allows personalization through favorites, subscriptions, and notifications.

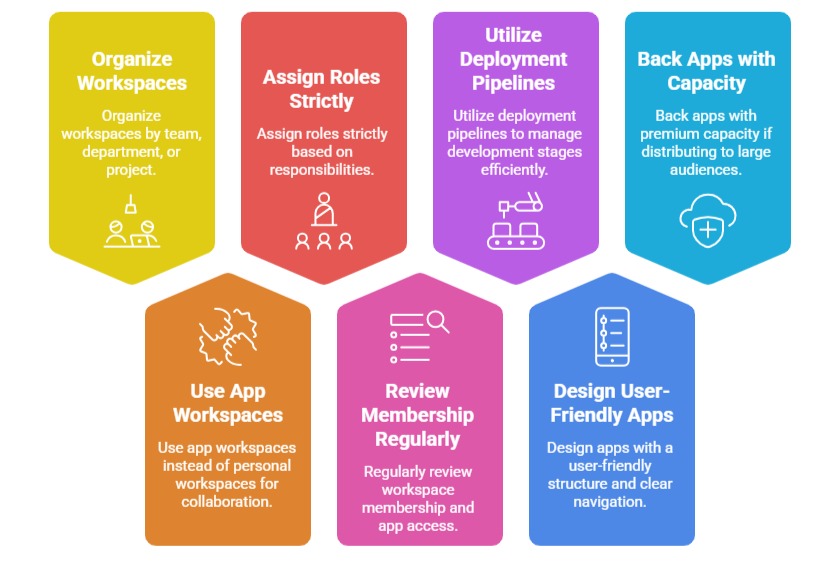
Best Practices for Workspaces and Apps


1. Organize workspaces by team, department, or project to maintain clear ownership and governance.

2. Use app workspaces instead of personal workspaces for collaboration to ensure content stability and team access.

3. Assign roles strictly based on responsibilities to maintain security and workflow integrity.

4. Regularly review workspace membership and app access to comply with organizational policies.

5. Utilize deployment pipelines to manage development, testing, and production stages efficiently.

6. Design apps with a user-friendly structure, minimal clutter, and clear navigation to improve adoption.

7. Back apps with premium capacity if distributing to large or external audiences to optimize performance.

Ryan Cole

Ryan Cole

Product Designer
Profile

Class Sessions

1- Overview of Business Intelligence Concepts 2- Power BI Ecosystem and Components 3- Understanding Power BI Desktop, Service, and Mobile App 4- Data-Driven Decision Making Fundamentals 5- Connecting to Data Sources (SQL, Excel, Cloud, APIs) 6- Data Import vs Direct Query 7- Power Query Editor Basics and Advanced Transformations 8- Data Cleaning, Shaping, and Formatting 9- Creating Query Parameters and Templates 10- Principles of Data Modeling in Power BI 11- Star Schema and Snowflake Schema Concepts 12- Creating and Managing Relationships Between Tables 13- Calculated Columns vs Measures 14- Role of Lookup and Fact Tables in BI 15- DAX Fundamentals and Syntax 16- Calculated Columns and Measures in Depth 17- Aggregation and Filter Functions 18- Time Intelligence Calculations (YTD, MTD, QTD, etc.) 19- Context in DAX: Row Context and Filter Context 20- Using Variables and Advanced Calculation Techniques 21- Dynamic Calculations and What-If Analysis 22- Hierarchies and Drill-Down Techniques 23- Working with Parent-Child and Many-to-Many Relationships 24- Optimizing DAX for Performance 25- Principles of Effective Data Visualization 26- Creating Interactive Reports and Dashboards 27- Choosing the Right Visuals (Charts, KPIs, Maps, Tables) 28- Using Bookmarks, Tooltips, and Drillthroughs 29- Applying Conditional Formatting and Visual Level Filters 30- Publishing Reports to Power BI Service 31- Workspaces and Apps in Power BI 32- Sharing and Collaborating Securely with Row-Level Security (RLS) 33- Scheduled Refresh and Data Gateway Configuration 34- Usage Metrics and Report Usage Monitoring 35- Real-Time Data Streaming and Dashboards 36- Integration with Azure Synapse and Cognitive Services 37- AI Features in Power BI: Insights, Q&A, and Anomaly Detection 38- Using Power Automate with Power BI for Workflow Automation 39- Implementing Predictive Analytics and Forecasting 40- Best Practices for Data Model Optimization 41- Query Reduction and Load Optimization Techniques 42- Troubleshooting Common Power BI Issues 43- Monitoring Performance with Performance Analyzer 44- Governance and Compliance Considerations in Power BI