USD ($)
$
United States Dollar
Euro Member Countries
India Rupee

Using Bookmarks, Tooltips, and Drillthroughs

Lesson 28/44 | Study Time: 20 Min

Using bookmarks, tooltips, and drillthroughs in Power BI significantly enhance interactivity, storytelling, and detailed data exploration within reports.

These features allow users to navigate complex datasets smoothly, access contextual information efficiently, and customize their experience to fit individual analytical needs.

By leveraging bookmarks, report creators can save specific views or filter states to guide users through data narratives. Tooltips provide additional data insights on hover without cluttering the visual space.

Drillthroughs enable deeper dives into focused data subsets from summary visuals, supporting layered analysis without overwhelming the main report page.

Together, these tools foster engaging, user-centric reports that balance high-level overview and granular detail. 

Bookmarks in Power BI

The purpose of bookmarks id to save the current state of a report page including filters, slicers, visibility, and drillthrough states.


Uses:


1. Create guided data stories or presentations with predefined sequences.

2. Toggle between different views like summary and detailed analysis.

3. Build navigation menus using bookmarks linked to buttons or images.


Creating Bookmarks:


1. Configure the desired page state.

2. Use the Bookmarks pane to add a new bookmark and name it descriptively.

3. Control what the bookmark captures—filters, visuals, spotlight, etc.

Tooltips in Power BI

The purpose is to show additional contextual data when users hover over data points in visuals without cluttering the report canvas.


Types:


1. Default Tooltips: Automatically generated with basic information from fields.

2. Report Page Tooltips: Custom-designed report pages used as enhanced tooltips with rich visuals and interactivity.


Best Practices:


1. Use concise and relevant information to complement visuals.

2. Design tooltip pages with clear layouts and avoid overloading.

3. Enable modern tooltips for enhanced formatting and interactions.

Drillthroughs in Power BI

The purpose is to enable users to navigate from summary level data to detailed report pages filtered by the selected data point.


Use Cases:


1. From a sales dashboard, drill through on a region to see detailed sales by city.

2. Access transaction-level details from aggregated KPIs.


Setting Up Drillthroughs:


1. Create a dedicated drillthrough page with one or more fields added to the Drillthrough filter pane.

2. Add a drillthrough button or use the right-click context menu in source visuals.

3. Optionally enable "Keep all filters" to retain slicer selections.
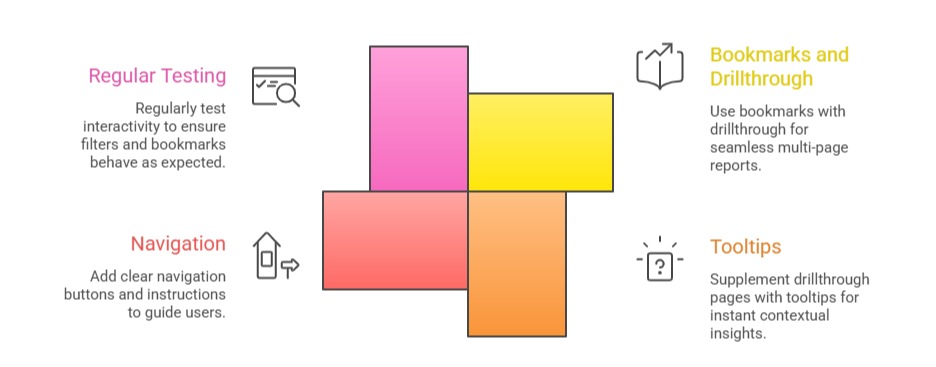
Combined Usage Tips


1. Use bookmarks together with drillthrough to create seamless, multi-page report experiences.

2. Supplement drillthrough pages with tooltips for instant contextual insights without leaving the page.

3. Add clear navigation buttons and instructions to guide users through bookmark sequences and drillthrough paths.

4. Regularly test interactivity to ensure filters and bookmarks behave as expected, avoiding confusion.

Ryan Cole

Ryan Cole

Product Designer
Profile

Class Sessions

1- Overview of Business Intelligence Concepts 2- Power BI Ecosystem and Components 3- Understanding Power BI Desktop, Service, and Mobile App 4- Data-Driven Decision Making Fundamentals 5- Connecting to Data Sources (SQL, Excel, Cloud, APIs) 6- Data Import vs Direct Query 7- Power Query Editor Basics and Advanced Transformations 8- Data Cleaning, Shaping, and Formatting 9- Creating Query Parameters and Templates 10- Principles of Data Modeling in Power BI 11- Star Schema and Snowflake Schema Concepts 12- Creating and Managing Relationships Between Tables 13- Calculated Columns vs Measures 14- Role of Lookup and Fact Tables in BI 15- DAX Fundamentals and Syntax 16- Calculated Columns and Measures in Depth 17- Aggregation and Filter Functions 18- Time Intelligence Calculations (YTD, MTD, QTD, etc.) 19- Context in DAX: Row Context and Filter Context 20- Using Variables and Advanced Calculation Techniques 21- Dynamic Calculations and What-If Analysis 22- Hierarchies and Drill-Down Techniques 23- Working with Parent-Child and Many-to-Many Relationships 24- Optimizing DAX for Performance 25- Principles of Effective Data Visualization 26- Creating Interactive Reports and Dashboards 27- Choosing the Right Visuals (Charts, KPIs, Maps, Tables) 28- Using Bookmarks, Tooltips, and Drillthroughs 29- Applying Conditional Formatting and Visual Level Filters 30- Publishing Reports to Power BI Service 31- Workspaces and Apps in Power BI 32- Sharing and Collaborating Securely with Row-Level Security (RLS) 33- Scheduled Refresh and Data Gateway Configuration 34- Usage Metrics and Report Usage Monitoring 35- Real-Time Data Streaming and Dashboards 36- Integration with Azure Synapse and Cognitive Services 37- AI Features in Power BI: Insights, Q&A, and Anomaly Detection 38- Using Power Automate with Power BI for Workflow Automation 39- Implementing Predictive Analytics and Forecasting 40- Best Practices for Data Model Optimization 41- Query Reduction and Load Optimization Techniques 42- Troubleshooting Common Power BI Issues 43- Monitoring Performance with Performance Analyzer 44- Governance and Compliance Considerations in Power BI

Sales Campaign

Sales Campaign

We have a sales campaign on our promoted courses and products. You can purchase 1 products at a discounted price up to 15% discount.