Working with parent-child and many-to-many relationships in Power BI addresses complex data modeling scenarios that go beyond simple one-to-many or one-to-one relationships.
These advanced relationship types are essential for accurately representing data structures such as organizational hierarchies or overlapping categorizations.
Parent-Child Relationships in Power BI
Parent-child relationships represent hierarchical data where each record references a parent record within the same table, such as organizational charts or bill of materials.
These require special handling in Power BI because they involve recursive relationships, which need self-referencing and sometimes DAX functions to flatten or parse the hierarchy efficiently for visualization and analysis.
Nature: Records in a single table relate to other records within the same table as parent or child.
Use Cases: Corporate organizational charts, product BOMs (Bill of Materials), folder structures, and category trees.
Implementation:
1. A column references the parent key (e.g., ManagerID refers to EmployeeID).
2. Use DAX functions like PATH(), PATHITEM(), and PATHLENGTH() to build and analyze hierarchical paths.
3. Convert parent-child into flattened hierarchies for reporting.
Visualization: Use matrix/table visuals with drill-down enabled to display hierarchical levels.
Many-to-Many Relationships in Power BI
Many-to-many relationships occur when multiple records in one table relate to multiple records in another, such as products assigned to multiple categories.
These relationships are more complex and require intermediary bridging tables or the use of composite models to manage filters and calculations correctly.
Nature: Multiple records in Table A relate to multiple records in Table B.
Examples: Products appearing in various categories, students enrolled in multiple courses.
Challenges: Standard relationships support only one-to-many or one-to-one cardinalities; many-to-many requires workarounds.
DAX Considerations: Use functions like TREATAS() to apply filters across many-to-many relationships precisely.
Best Practices for Working with These Relationships
Well-defined relationship practices improve model clarity and analytical accuracy. Listed below are the key recommendations for managing parent-child and many-to-many relationships.
For parent-child:
1. Create explicit parent key columns and use DAX path functions to manage levels.
2. Ensure data consistency to avoid orphaned records.
3. Flatten hierarchies for better integration with Power BI visuals.
For many-to-many:
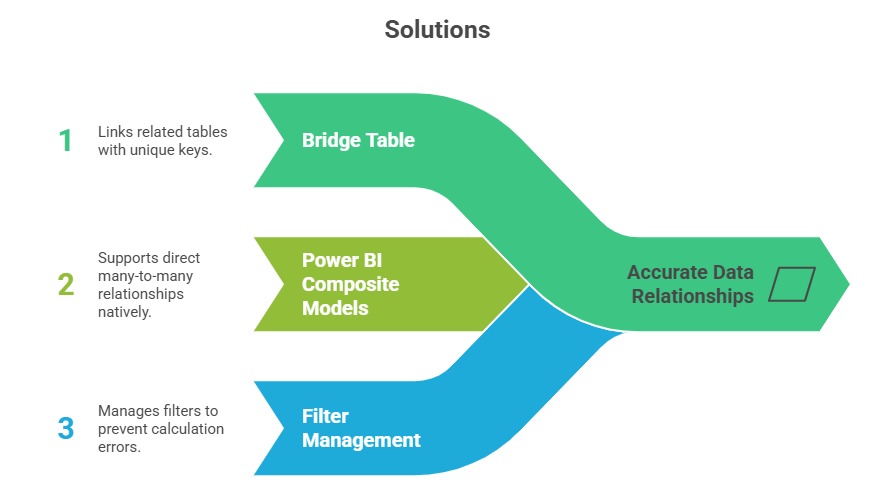
1. Use bridge tables with unique keys linking both sides of the relationship.
2. Prefer Power BI's native many-to-many support where possible, but validate filter behavior.
3. Test measures for correctness and ambiguity, especially with complex slicers and filters.

Class Sessions
Sales Campaign

We have a sales campaign on our promoted courses and products. You can purchase 1 products at a discounted price up to 15% discount.