Data-driven decision making (DDDM) is a structured approach where business decisions are based on data analysis and interpretation rather than intuition or gut feelings.
This methodology involves gathering relevant data from a variety of sources, processing and analyzing it to extract meaningful insights, and then using these insights to guide strategic and operational decisions that align with organizational goals.
In today’s fast-evolving business landscape, where volumes of data are generated daily, DDDM enables companies to make informed decisions that are objective, accurate, and timely, improving competitive advantage and operational efficiency.
The fundamentals of data-driven decision making encompass several critical steps and principles. First, organizations must clearly define their business objectives and key performance indicators (KPIs), which guide what data to collect and analyze.
Next, data is collected from internal systems like CRM, ERP, or external sources such as market trends and customer feedback. This data undergoes cleansing, integration, and preparation to ensure quality and consistency.
Advanced analytics and statistical models are then applied to identify trends, correlations, and predictive insights. Decision-makers interpret these results to formulate strategies or actions and carry out implementation.
Lastly, continuous monitoring and feedback loops help evaluate the outcomes and refine future decisions.
Key Elements of Data-Driven Decision Making
Successful data-driven decision making follows a systematic process from goal setting to performance monitoring. The following list presents the core elements that enable reliable and impactful decisions.
1. Objective Setting and KPI Definition: Establish clear goals and metrics that data analysis will support, ensuring alignment with business strategy.
2. Data Collection and Integration: Aggregate data from multiple sources, including operational databases, analytics platforms, social media, and third-party datasets.
3. Data Quality Management: Cleanse data to address inaccuracies, duplicates, and inconsistencies to maintain reliable results.
4. Analytics and Modeling: Use descriptive, diagnostic, predictive, and prescriptive analytics techniques to derive actionable insights.
5. Evidence-Based Decision Making: Decisions are justified and validated through empirical data, minimizing biases and subjective judgment.
6. Implementation and Change Management: Apply insights effectively through planning, execution, and communication within the organization.
7. Continuous Monitoring and Improvement: Track performance post-implementation to adapt strategies dynamically based on new data and feedback.
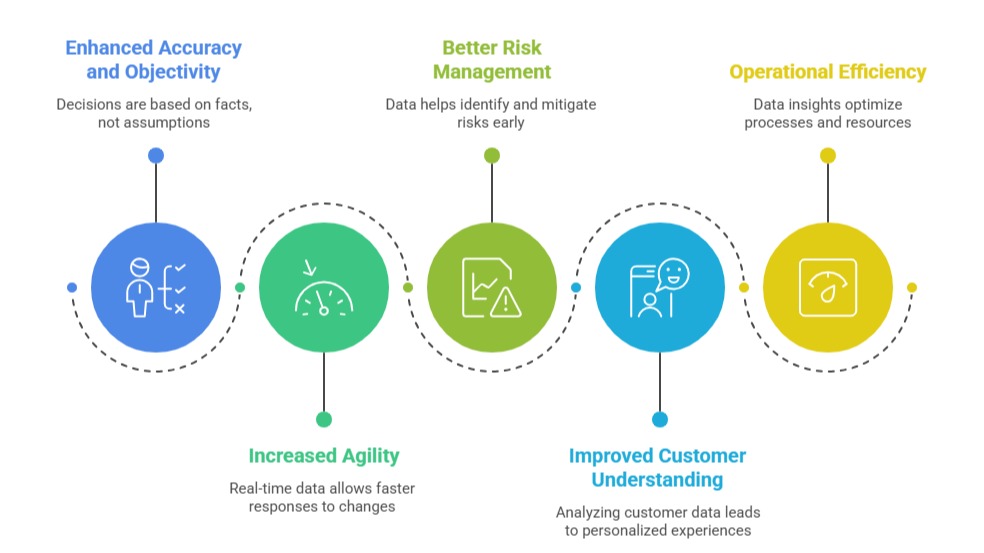
Benefits of Data-Driven Decision Making

Class Sessions
Sales Campaign

We have a sales campaign on our promoted courses and products. You can purchase 1 products at a discounted price up to 15% discount.