Integration with Azure Synapse and Cognitive Services empowers Power BI users with scalable, advanced analytics and AI-driven insights, transforming raw data into actionable business intelligence.
Azure Synapse offers a unified analytics workspace combining big data, data warehousing, and powerful data processing capabilities, while Power BI provides rich visualization and reporting layers.
This integration enables seamless data preparation, modeling, and visualization workflows, enhancing real-time analytics and enterprise-scale decision-making.
Cognitive Services integration enriches analytics by infusing AI capabilities like sentiment analysis, language detection, image recognition, and anomaly detection.
These services process unstructured data across text, images, and conversational inputs, adding deep intelligence to reports and dashboards.
Together with Azure Synapse, Power BI enables organizations to create enterprise-grade semantic models, apply role-based security, and provide near-real-time dashboards with high performance and extensive security compliance.
Integration with Azure Synapse Analytics
Azure Synapse serves as the backbone for enterprise-scale analytics architectures. The main features listed below illustrate how Power BI connects natively to Synapse for optimized insights.
1. Unified Analytics Workspace: Combines SQL pools, Spark, data lakes, and pipelines into a single environment for data ingestion, processing, and management.
2. Native Power BI Connectivity:
Link Power BI workspaces directly in Synapse Studio for creating reports and datasets.
Use DirectQuery to connect live to Synapse SQL pools, enabling near real-time data access without duplication.
3. Data Preparation and Modeling: SQL and Spark in Synapse prepare and model data before feeding it into Power BI, streamlining ETL and allowing complex transformations within the Synapse environment.
4. Security and Governance: Leverages Azure Active Directory, Role-Based Access Control (RBAC), and integration with Azure Purview for comprehensive data lineage and audit trails.
5. Scalability and Performance: Handles petabytes of data with serverless and provisioned options, enabling performance-optimized reporting at scale.
Integration with Azure Cognitive Services
Power BI supports real-time AI-driven analytics via Cognitive Services and Azure ML integration. The main features listed below illustrate how organizations can embed intelligence directly into dashboards and reports.
1. AI-Powered Analytics: Adds pre-built machine learning models for text analytics (sentiment, key phrase extraction), vision analysis, speech recognition, and anomaly detection.
2. Embedding AI in Reports: Power BI supports invoking Cognitive Services via APIs or integration with Azure ML for real-time AI-driven predictions and insights.
3. Processing Unstructured Data: Enables analysis of customer feedback, social media data, images, documents, and voice to surface qualitative insights alongside quantitative data.
4. Customization: Users can train custom models or leverage AutoML capabilities for tailored AI scenarios within the Power BI and Synapse ecosystem.
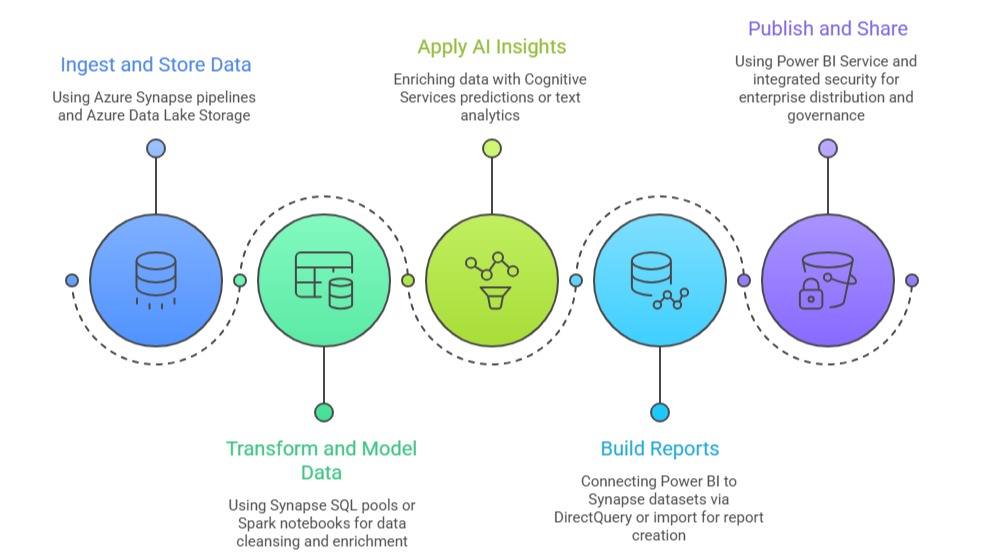
Workflow Overview

Class Sessions
Sales Campaign

We have a sales campaign on our promoted courses and products. You can purchase 1 products at a discounted price up to 15% discount.