Using Power Automate with Power BI for workflow automation transforms how businesses handle data-driven processes by connecting insights directly to actionable tasks.
Power Automate is a cloud-based service that allows users to create automated workflows between apps and services, helping streamline repetitive tasks and improve productivity.
Integrating Power BI with Power Automate enables organizations to trigger automated actions based on data changes, user interactions, or business events within reports and dashboards, bridging the gap between data visualization and enterprise operations.
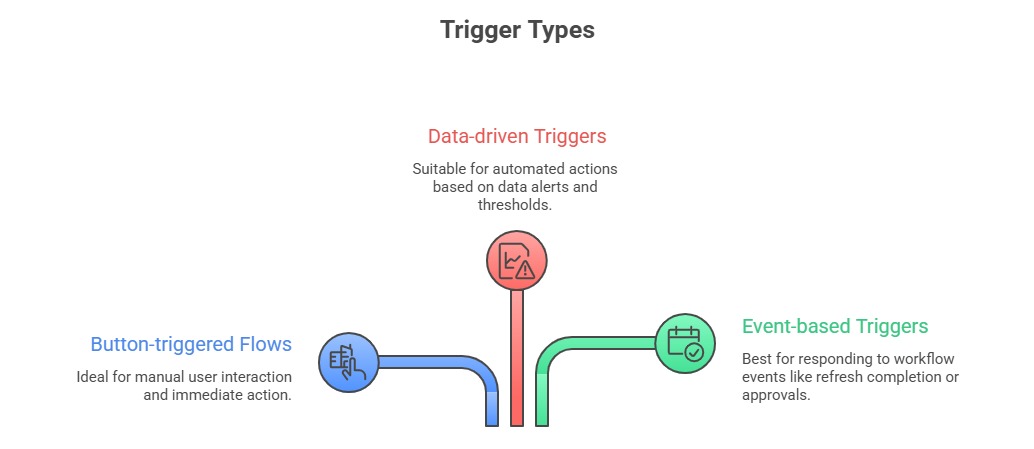
This seamless integration empowers users to devise workflows such as alerting stakeholders when KPIs exceed thresholds, refreshing datasets and notifying teams, or initiating approvals directly from Power BI visuals.
By embedding flows into Power BI reports or using data-driven triggers, Power Automate enhances responsiveness, reduces manual workloads, and aligns analytics with business processes.
The result is a cohesive, automated ecosystem where insights drive immediate, measurable outcomes.
How Power Automate Integrates with Power BI
Power Automate transforms Power BI from a reporting tool into an action-enabled analytics platform. The integration methods and use cases below show how organizations operationalize insights at scale.
Common Use Cases:
1. Send automated emails or Microsoft Teams notifications when Power BI alerts fire.
2. Update CRM or ERP systems based on Power BI insights or data changes.
3. Create approval workflows triggered by anomalies or exceptions detected in reports.
4. Initiate data refreshes and notify users upon completion or failure.
5. Log data or audit trails automatically from interactive report usage.
Implementing Power Automate Workflows in Power BI
Power Automate extends Power BI by enabling automated actions and workflows based on data insights. The key steps below explain how to create, embed, trigger, and manage workflows effectively.
1. Create Power Automate Flows: Use the Power Automate portal to design flows connecting Power BI with other applications such as SharePoint, Outlook, Teams, or external APIs.
2. Embed Flows in Power BI Reports: Add Power Automate visual components or buttons in reports that users can interact with to start flows.
3. Configure Data Alerts: Set data alerts on key metrics within Power BI Service to trigger flows automatically.
4. Monitor and Manage: Track flow runs, successes, and failures within the Power Automate admin interface for continuous improvement.
Benefits of Using Power Automate with Power BI
The key benefits below highlight how this integration improves responsiveness, collaboration, and efficiency.
1. Enhanced Agility: Respond to insights rapidly with automated workflows, reducing latency between analysis and action.
2. Improved Collaboration: Integrated notifications and approvals streamline communication across teams.
3. Reduced Manual Effort: Automates repetitive tasks, minimizes errors, and frees analysts to focus on strategic activities.
4. Comprehensive Integration: Connects Power BI with 500+ services and custom connectors for expansive automation scenarios.

Class Sessions
Sales Campaign

We have a sales campaign on our promoted courses and products. You can purchase 1 products at a discounted price up to 15% discount.