Real-time data streaming and dashboards in Power BI enable organizations to monitor key metrics, events, and operations with minimal latency, providing up-to-date insights crucial for agile decision-making.
Unlike traditional static reports, real-time dashboards continuously refresh as new data arrives, allowing users to respond promptly to changing business conditions such as sales spikes, network status, or operational alerts.
Power BI accomplishes this through streaming datasets, push datasets, and integration with Azure services, offering flexible architectures for diverse real-time analytics use cases.
Integrating real-time data into dashboards involves connecting Power BI to streaming sources like IoT devices, sensors, application logs, or event hubs.
These data flows update dashboards automatically without requiring manual refresh or periodic polling. Users can leverage Power BI’s native streaming tiles, custom visuals, and alerts to visualize and take action on live data streams.
Designing efficient real-time dashboards requires balancing update frequency, data volume, and visualization complexity to maintain responsiveness and meaningfulness.
Real-Time Data Streaming in Power BI
Power BI supports real-time analytics through different data ingestion models. The main methods below describe how live data is streamed, stored, and combined for reporting.
1. Streaming Datasets:
Data is pushed into Power BI and visualized instantaneously.
Supports REST APIs, Azure Stream Analytics, or PubNub integrations.
Does not store historical data unless combined with a push dataset or dataflows.
2. Push Datasets:
Data pushed into Power BI and saved for historical analysis.
Enables a combination of real-time and historical reporting.
3. Hybrid Datasets: Combine real-time data with scheduled refresh data in Power BI for comprehensive insights.
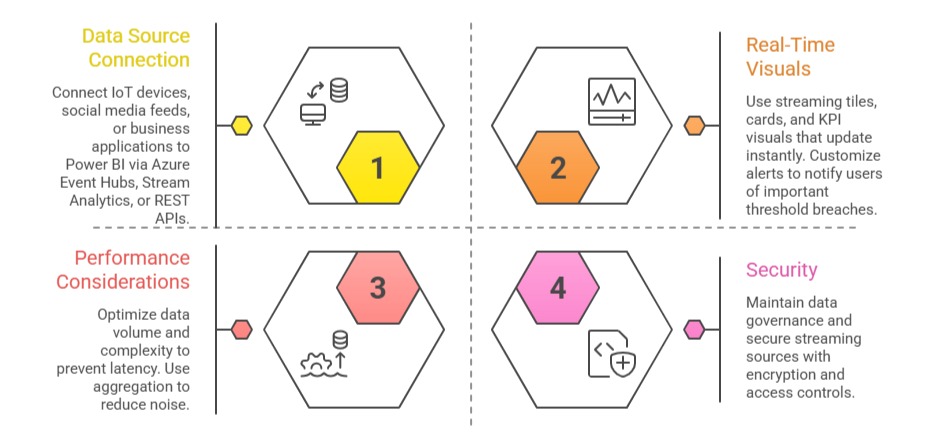
Building Real-Time Dashboards
Successful real-time dashboards balance speed, clarity, and security. The main steps below outline how to connect live data sources and design dashboards that update instantly.
Use Cases of Real-Time Dashboards
1. Operations Monitoring: Track system performance, error rates, or supply chain logistics in real time.
2. Sales and Marketing: Monitor live campaign results, website traffic, and sales conversions instantly.
3. Customer Support: Visualize live call center statuses and ticket resolutions for service optimization.
4. IoT Analytics: Analyze sensor data streams to detect faults, anomalies, or predictive maintenance signals.
