USD ($)
$
United States Dollar
Euro Member Countries
India Rupee

Time Intelligence Calculations (YTD, MTD, QTD, etc.)

Lesson 18/44 | Study Time: 15 Min

Time intelligence calculations are an essential aspect of business analytics in Power BI, allowing users to analyze data across varying time periods to detect trends, seasonal patterns, and business cycles.

These calculations transform raw date data into insightful metrics such as Year-to-Date (YTD), Month-to-Date (MTD), and Quarter-to-Date (QTD) values, enabling decision-makers to understand performance compared to previous periods and forecast future outcomes effectively. 

Power BI provides an extensive set of DAX time intelligence functions that simplify these calculations by leveraging a properly structured date table in the data model.

These functions handle date filtering, aggregation, and comparison across standard time frames with minimal effort; they also facilitate custom period definitions for fiscal years or rolling windows.

Time intelligence functions enable users to evaluate cumulative totals, period-over-period growth, moving averages, and granular date slicing, which are vital for performance measurement and strategic planning.

Common Time Intelligence Calculations

Time intelligence calculations help analyze performance across different time periods. The key calculations listed below explain how DAX enables meaningful period-based comparisons and trends.


1. Year-to-Date (YTD)


Aggregates data from the start of the year up to the current date.

Useful for tracking annual progress in sales, expenses, or other KPIs.


Example DAX:

Total Sales YTD = TOTALYTD(SUM(Sales[Amount]), 'Date'[Date])


2. Month-to-Date (MTD)


Aggregates data from the beginning of the current month to the present date.

Helps assess monthly performance trends.


Example DAX:

Total Sales MTD = TOTALMTD(SUM(Sales[Amount]), 'Date'[Date])


3. Quarter-to-Date (QTD)


Aggregates data from the start of the current quarter to today.

Useful for quarterly performance reviews.


Example DAX:

Total Sales QTD = TOTALQTD(SUM(Sales[Amount]), 'Date'[Date])


4. Previous Period Comparisons


Functions like SAMEPERIODLASTYEAR(), PREVIOUSMONTH(), PREVIOUSQUARTER() enable comparisons with equivalent previous periods.

Important for understanding growth or decline patterns.


Example DAX:

Sales Last Year = CALCULATE(SUM(Sales[Amount]), SAMEPERIODLASTYEAR('Date'[Date]))


5. Rolling or Moving Averages


Calculates averages over a sliding window of days, weeks, or months to smooth out variability.

Useful for trend analysis and forecasting.

Custom formulas often combine DATESINPERIOD() or DATESBETWEEN() with aggregation.

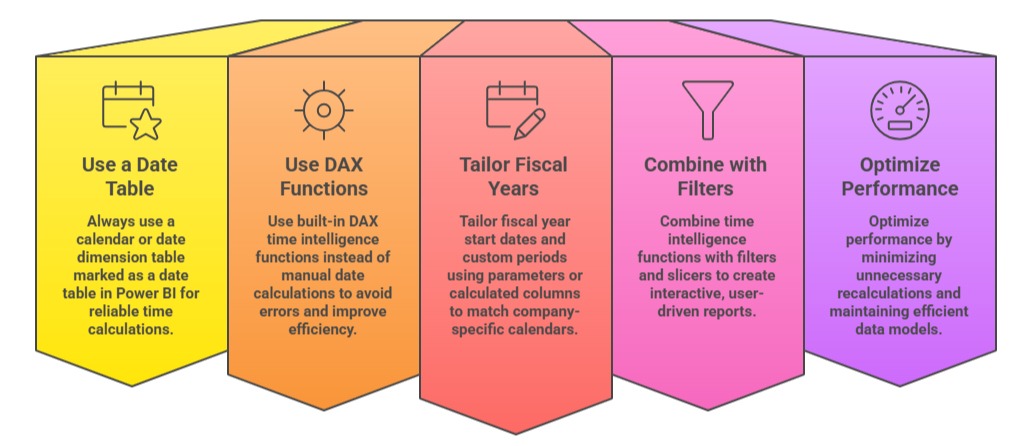
Best Practices for Time Intelligence Calculations


1. Always use a calendar or date dimension table that is marked as a date table in Power BI for reliable time calculations.

2. Use built-in DAX time intelligence functions instead of manual date calculations to avoid errors and improve efficiency.

3. Tailor fiscal year start dates and custom periods using parameters or calculated columns to match company-specific calendars.

4. Combine time intelligence functions with filters and slicers to create interactive, user-driven reports.

5. Optimize performance by minimizing unnecessary recalculations and maintaining efficient data models.

Ryan Cole

Ryan Cole

Product Designer
Profile

Class Sessions

1- Overview of Business Intelligence Concepts 2- Power BI Ecosystem and Components 3- Understanding Power BI Desktop, Service, and Mobile App 4- Data-Driven Decision Making Fundamentals 5- Connecting to Data Sources (SQL, Excel, Cloud, APIs) 6- Data Import vs Direct Query 7- Power Query Editor Basics and Advanced Transformations 8- Data Cleaning, Shaping, and Formatting 9- Creating Query Parameters and Templates 10- Principles of Data Modeling in Power BI 11- Star Schema and Snowflake Schema Concepts 12- Creating and Managing Relationships Between Tables 13- Calculated Columns vs Measures 14- Role of Lookup and Fact Tables in BI 15- DAX Fundamentals and Syntax 16- Calculated Columns and Measures in Depth 17- Aggregation and Filter Functions 18- Time Intelligence Calculations (YTD, MTD, QTD, etc.) 19- Context in DAX: Row Context and Filter Context 20- Using Variables and Advanced Calculation Techniques 21- Dynamic Calculations and What-If Analysis 22- Hierarchies and Drill-Down Techniques 23- Working with Parent-Child and Many-to-Many Relationships 24- Optimizing DAX for Performance 25- Principles of Effective Data Visualization 26- Creating Interactive Reports and Dashboards 27- Choosing the Right Visuals (Charts, KPIs, Maps, Tables) 28- Using Bookmarks, Tooltips, and Drillthroughs 29- Applying Conditional Formatting and Visual Level Filters 30- Publishing Reports to Power BI Service 31- Workspaces and Apps in Power BI 32- Sharing and Collaborating Securely with Row-Level Security (RLS) 33- Scheduled Refresh and Data Gateway Configuration 34- Usage Metrics and Report Usage Monitoring 35- Real-Time Data Streaming and Dashboards 36- Integration with Azure Synapse and Cognitive Services 37- AI Features in Power BI: Insights, Q&A, and Anomaly Detection 38- Using Power Automate with Power BI for Workflow Automation 39- Implementing Predictive Analytics and Forecasting 40- Best Practices for Data Model Optimization 41- Query Reduction and Load Optimization Techniques 42- Troubleshooting Common Power BI Issues 43- Monitoring Performance with Performance Analyzer 44- Governance and Compliance Considerations in Power BI

Sales Campaign

Sales Campaign

We have a sales campaign on our promoted courses and products. You can purchase 1 products at a discounted price up to 15% discount.