Creating interactive reports and dashboards in Power BI involves designing compelling, user-friendly data presentations that allow users to explore and analyze information dynamically.
Interactive reports enhance engagement by enabling viewers to filter, drill down, slice, and pivot data based on their specific interests, making insights more accessible and actionable.
Dashboards aggregate this interactivity into concise, visual summaries across multiple reports or datasets, providing real-time monitoring of key metrics and trends critical for informed decision-making.
To build effective interactive reports and dashboards, careful planning of data models, thoughtful selection of visuals, and strategic use of Power BI’s features such as slicers, drill-throughs, bookmarks, and dynamic tooltips are essential.
Designing with the audience in mind ensures that complexity is balanced with usability—executives might prefer high-level summaries with simple interactions, while analysts benefit from detailed filters and cross-visual highlighting.
Performance optimization and clear visual hierarchy maintain responsiveness and clarity as users navigate the data story.
Steps to Creating Interactive Reports
Interactive report creation follows a logical workflow from data connection to final usability validation. The following steps explain how to build reports that are dynamic, intuitive, and impactful.
1. Connect and Prepare Data: Ensure clean, well-structured data with optimized relationships and calculated measures.
2. Select Appropriate Visuals: Use charts and visuals that best represent the data (bar, line, pie, matrix, maps). Avoid clutter.
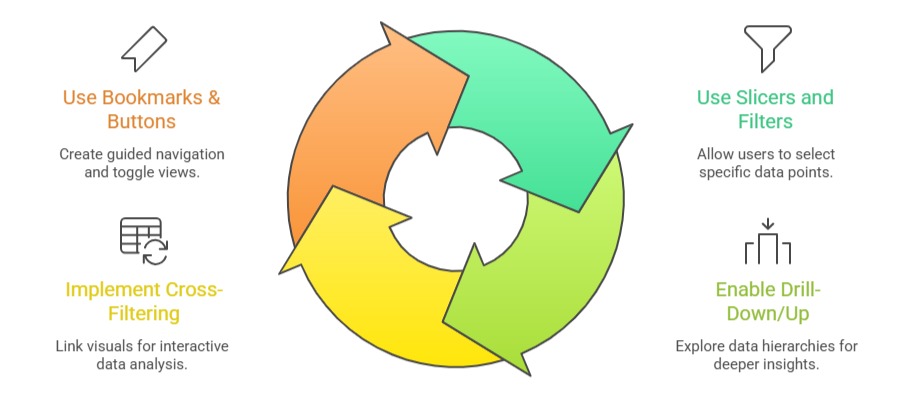
3. Add Interactivity:
4. Dynamic Titles and Tooltips: Use DAX to create titles and tooltips that change based on filter context to improve clarity.
5. Personalize Visual Formatting: Customize colors, fonts, and layouts consistent with branding; ensure visual contrast and readability.
6. Test User Experience: Validate usability across devices and user skill levels; refine interactions and layout for simplicity.
Designing Effective Dashboards
Understanding effective dashboard design is essential for delivering meaningful business insights. The main points below describe how to create dashboards that are focused, accessible, and scalable.
1. Focus on Key Metrics: Prioritize KPIs and critical data points; limit visuals to maintain focus.
2. Organize Layout Logically: Group related visuals, place summary cards on top, and align for visual flow.
3. Use Consistent Color Palette: Use color to highlight insights, categorize data, and maintain accessibility.
4. Real-Time Data Refresh: Configure data gateways and refresh schedules to keep dashboards current.
5. Optimize for Performance: Limit excessive visuals, reduce dataset size, and optimize DAX calculations.
6. Enable Sharing and Collaboration: Use Power BI Service workspaces for collaborative development and sharing.
7. Mobile Optimization: Design for responsiveness; test on mobile apps for executive on-the-go access.

Class Sessions
Sales Campaign

We have a sales campaign on our promoted courses and products. You can purchase 1 products at a discounted price up to 15% discount.