Aggregation and filter functions are fundamental tools in Power BI's DAX language that enable users to summarize, analyze, and manipulate data effectively.
Aggregation functions compute summary values like totals, averages, or counts, transforming detailed data into actionable insights. Filter functions modify or refine the context of data by including or excluding records based on specified criteria.
Together, these functions provide the backbone for many dynamic and interactive calculations critical to business intelligence and reporting.
Aggregation Functions in Power BI
Aggregation functions calculate single, summarized values from a column of data. Common aggregation functions include:
SUM: Adds all numbers in a column.
AVERAGE: Calculates the mean of numerical values.
COUNT: Counts rows that contain a number or non-blank values.
COUNTROWS: Counts the number of rows in a table or a filtered table.
MIN & MAX: Find the smallest and largest values respectively.
DISTINCTCOUNT: Counts the number of unique values in a column.
Example:
Total Sales = SUM(Sales[Amount]) — sums all sales amounts considering the current filter context.
Filter Functions in Power BI
Filter functions modify the data context or enforce conditions to select specific subsets of data for calculations:
1. FILTER(): Returns a table that meets specific conditions. Example:
FILTER(Sales, Sales[Region] = "West") — filters sales data for the "West" region.
2. ALL(): Removes all filters from specified columns or tables, often used to calculate overall totals regardless of filters. Example:
Total Sales All = CALCULATE(SUM(Sales[Amount]), ALL(Sales))
3. ALLEXCEPT(): Removes filters from all columns except specified ones, preserving specific context.
4. VALUES(): Returns unique values from a column, often used in calculations involving distinct counts.
5. RELATEDTABLE(): Fetches related rows from another table based on relationships for filtering.
6. KEEPFILTERS(): Modifies filter behavior to retain filters rather than replacing them.
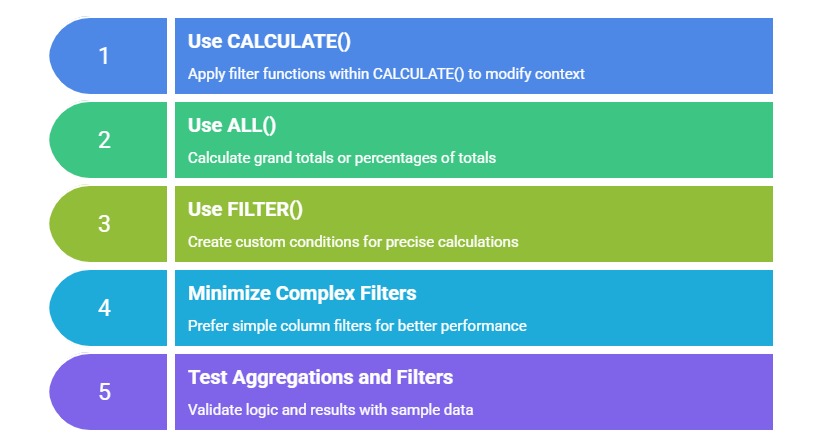
Filter functions are commonly used inside the CALCULATE() function to modify filter context for dynamic calculations.
Interaction Between Aggregation and Filter Functions
Aggregation functions perform calculations on subsets of data defined by filter functions, creating context-sensitive summaries. This combination enables powerful analytical expressions such as:
1. Calculating totals within specific categories or time periods.
2. Ranking values by applying complex filter criteria.
3. Comparing filtered results to overall totals or benchmarks.
4. Implementing conditional aggregations, e.g., sales for top-performing products.
Example:
Sales West Region = CALCULATE(SUM(Sales[Amount]), FILTER(Sales, Sales[Region]="West"))This measure calculates total sales, filtered only for the "West" region.
Common Patterns and Practices

Class Sessions
Sales Campaign

We have a sales campaign on our promoted courses and products. You can purchase 1 products at a discounted price up to 15% discount.