Power BI Ecosystem and Components is a foundational topic that explains the comprehensive environment of tools, services, and capabilities that make Power BI an effective business intelligence platform.
Power BI, developed by Microsoft, is a suite of business analytics tools that enables users to connect to various data sources, transform data into meaningful insights, and share those insights across organizations securely and interactively.
This ecosystem supports different user roles, including data analysts, IT administrators, and business decision-makers, creating a collaborative data culture.
Core Components of the Power BI Ecosystem
The Power BI ecosystem is composed of several integrated components that work together to facilitate the entire BI lifecycle – from data ingestion to report sharing.
1. Power BI Desktop
This is the primary authoring tool where data analysts and developers create data models, reports, and dashboards. It provides robust features for connecting to multiple data sources, data cleansing, transformation using Power Query, and advanced analytics, including the use of DAX (Data Analysis Expressions).
Reports created in Desktop can be published to the Power BI service for broader distribution.
2. Power BI Service (Power BI Online)
A cloud-based platform for collaboration, sharing, and administration of Power BI content. It allows users to publish reports, create dashboards, and configure data refresh schedules.
It also supports workspace creation for team collaboration, user access control, and content distribution through apps. Features such as Q&A allow users to ask natural language queries to explore data interactively.
3. Power BI Mobile
It provides on-the-go access to reports and dashboards for end-users via mobile devices. As well as supports real-time notifications and alerts to keep users updated on critical metrics.
4. Power BI Report Server
An on-premises report server that allows organizations to host Power BI reports within their own data centers. Ideal for businesses with data residency or compliance requirements restricting cloud usage.
5. Power BI Data Gateway
This facilitates secure data transfer between on-premises data sources and Power BI cloud services. It also enables scheduled refreshes and live queries for on-premises data sources.
6. Power Query
A data connectivity and transformation tool embedded within Power BI Desktop and Excel. Provides a user-friendly interface to extract, transform, and load (ETL) data from various sources.
7. Power Pivot
A data modeling engine that supports in-memory storage and complex calculations using DAX. It allows building sophisticated relational models within Power BI.
8. Power BI Visuals
It includes a wide array of built-in data visualizations and custom visuals available via the AppSource marketplace. Visuals facilitate data storytelling through bar charts, slicers, KPIs, maps, and more.
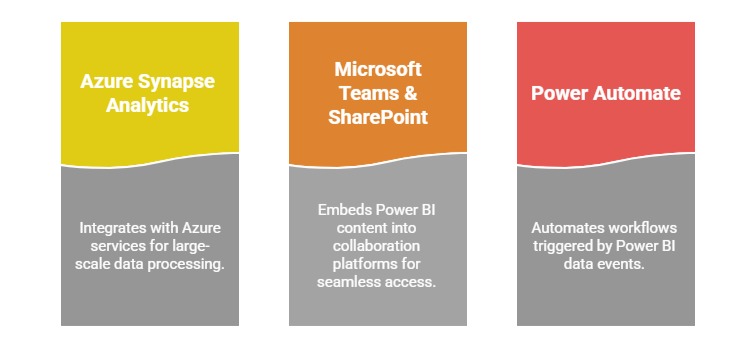
Related Services and Integrations

Class Sessions
Sales Campaign

We have a sales campaign on our promoted courses and products. You can purchase 1 products at a discounted price up to 15% discount.