USD ($)
$
United States Dollar
Euro Member Countries
India Rupee

Sharing and Collaborating Securely with Row-Level Security (RLS)

Lesson 32/44 | Study Time: 20 Min

Sharing and collaborating securely with Row-Level Security (RLS) in Power BI is a vital practice for protecting sensitive data while enabling personalized data access for different users or groups.

RLS restricts data visibility within reports and dashboards by filtering data dynamically based on the user’s identity, ensuring individuals only see data they are authorized to access.

Implementing RLS allows organizations to enforce data governance, comply with privacy regulations, and foster trust while maintaining the collaborative and interactive nature of Power BI reporting.

RLS is configured by defining security roles in Power BI Desktop using DAX filter expressions on tables, and then assigning users or Azure Active Directory (AAD) groups to these roles in the Power BI Service.

This approach enables data differentiation without multiplying report versions or datasets.

Combined with workspaces, apps, and sharing capabilities, RLS offers a robust framework for scalable and secure BI deployments supporting diverse teams and stakeholders with tailored data views.

Key Concepts of Row-Level Security (RLS)

Row-Level Security enables fine-grained data access within shared reports and dashboards. Listed below are the key concepts that define how RLS works in Power BI.


1. Role Definition


Create roles in Power BI Desktop with DAX filters restricting rows based on user or attribute values (e.g., region, department).

Example: Sales[Region] = "West" limits data to Western region sales only.


2. Role Assignment


After publishing, assign users or groups to roles using Power BI Service’s security settings.

Supports Azure AD groups for scalable management.


3. Dynamic Row Filtering

Utilize UserPrincipalName() function in DAX to dynamically filter data based on logged-in user email or username.

Example:

text
Sales[SalesPersonEmail] = USERPRINCIPALNAME()


4. Testing and Validation:


Test roles within Power BI Desktop using the “View as Role” feature before publishing.

Validate user access in Power BI Service by simulating role membership.

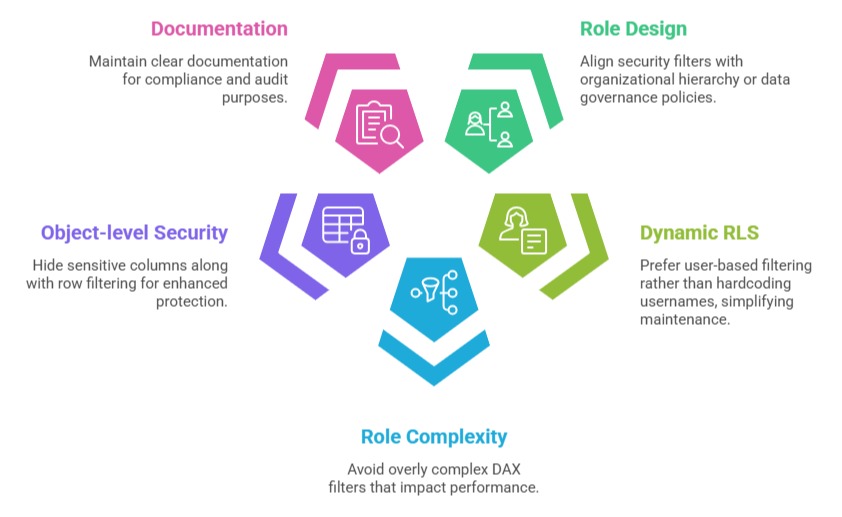
Best Practices for Secure RLS Implementation

Strong RLS practices help protect sensitive data while enabling controlled data access. The list below highlights key techniques for implementing secure and scalable RLS.


1. Design Roles Based on Business Logic: Align security filters with organizational hierarchy or data governance policies.

2. Use Dynamic RLS for Scalability: Prefer user-based filtering rather than hardcoding usernames, simplifying maintenance.

3. Minimize Role Complexity: Avoid overly complex DAX filters that impact performance.

4. Combine RLS with Object-level Security: Hide sensitive columns along with row filtering for enhanced protection.

5. Document Security Rules: Maintain clear documentation for compliance and audit purposes.

Collaboration With RLS


1. Users with assigned roles can safely share reports and dashboards, confident that underlying data remains within authorization boundaries.

2. RLS supports multiple users accessing the same report with different data views, enhancing collaboration without data duplication.

3. Integration with Power BI Apps and Workspaces allows controlled distribution and management within teams.

Ryan Cole

Ryan Cole

Product Designer
Profile

Class Sessions

1- Overview of Business Intelligence Concepts 2- Power BI Ecosystem and Components 3- Understanding Power BI Desktop, Service, and Mobile App 4- Data-Driven Decision Making Fundamentals 5- Connecting to Data Sources (SQL, Excel, Cloud, APIs) 6- Data Import vs Direct Query 7- Power Query Editor Basics and Advanced Transformations 8- Data Cleaning, Shaping, and Formatting 9- Creating Query Parameters and Templates 10- Principles of Data Modeling in Power BI 11- Star Schema and Snowflake Schema Concepts 12- Creating and Managing Relationships Between Tables 13- Calculated Columns vs Measures 14- Role of Lookup and Fact Tables in BI 15- DAX Fundamentals and Syntax 16- Calculated Columns and Measures in Depth 17- Aggregation and Filter Functions 18- Time Intelligence Calculations (YTD, MTD, QTD, etc.) 19- Context in DAX: Row Context and Filter Context 20- Using Variables and Advanced Calculation Techniques 21- Dynamic Calculations and What-If Analysis 22- Hierarchies and Drill-Down Techniques 23- Working with Parent-Child and Many-to-Many Relationships 24- Optimizing DAX for Performance 25- Principles of Effective Data Visualization 26- Creating Interactive Reports and Dashboards 27- Choosing the Right Visuals (Charts, KPIs, Maps, Tables) 28- Using Bookmarks, Tooltips, and Drillthroughs 29- Applying Conditional Formatting and Visual Level Filters 30- Publishing Reports to Power BI Service 31- Workspaces and Apps in Power BI 32- Sharing and Collaborating Securely with Row-Level Security (RLS) 33- Scheduled Refresh and Data Gateway Configuration 34- Usage Metrics and Report Usage Monitoring 35- Real-Time Data Streaming and Dashboards 36- Integration with Azure Synapse and Cognitive Services 37- AI Features in Power BI: Insights, Q&A, and Anomaly Detection 38- Using Power Automate with Power BI for Workflow Automation 39- Implementing Predictive Analytics and Forecasting 40- Best Practices for Data Model Optimization 41- Query Reduction and Load Optimization Techniques 42- Troubleshooting Common Power BI Issues 43- Monitoring Performance with Performance Analyzer 44- Governance and Compliance Considerations in Power BI