Dynamic calculations and What-If analysis are advanced capabilities in Power BI that enable users to explore various business scenarios and analyze potential outcomes interactively.
Dynamic calculations adjust in real-time based on user selections, filters, or parameter inputs, providing flexible and responsive reporting.
What-If analysis allows users to create hypothetical situations by changing input variables and instantly observing how these changes impact key performance metrics, facilitating data-driven forecasting and decision-making.
With dynamic calculations, Power BI uses DAX measures that recalculate instantly as the filter context changes, making visuals responsive and insightful.
What-If parameters are created as slicers or input fields in reports, allowing end-users to alter values like price, volume, or discount rates to examine “what would happen if” these factors change.
This integration of interactivity and real-time computation supports scenario modeling, budgeting, sensitivity analysis, and risk assessment directly within Power BI dashboards.
Dynamic Calculations in Power BI
Calculations that update automatically based on report filters, slicers, and user interaction.
Implementation: Use DAX Measures that leverage filter context to change aggregate computations dynamically.
Common Use Cases: Sales by region affected by product selection, revenue forecasts adjusting by time periods, profit margins adapting to cost changes.
Tools: Functions like CALCULATE(), context transition, and variables facilitate dynamic formulas.
Example:
Dynamic Sales = CALCULATE(SUM(Sales[Amount]), Filters)This measure recalculates total sales dynamically as the report filters are applied.
What-If Analysis in Power BI
Power BI provides built-in What-If parameters for interactive scenario modeling. Listed below are the core components that enable dynamic input-driven analysis.
1. What-If Parameter Creation
Power BI allows users to create numeric parameters with a specified range, increment, and default value.
These parameters generate slicers that users can manipulate to input hypothetical values.
2. Integration into Calculations
What-If parameters are incorporated into DAX measures to affect calculations dynamically.
This lets users test scenarios such as price increases, budget changes, or market growth assumptions.
3. Use Cases
Budget forecasting based on changes in cost inputs.
Sales impact analysis from varying discount levels.
ROI sensitivity to investment adjustments.
Example:
Create a What-If parameter DiscountRate ranging from 0% to 50%, then use it in a measure:
Adjusted Sales = SUM(Sales[Amount]) * (1 - 'DiscountRate'[DiscountRate Value])The result changes as the user adjusts DiscountRate using the slicer.
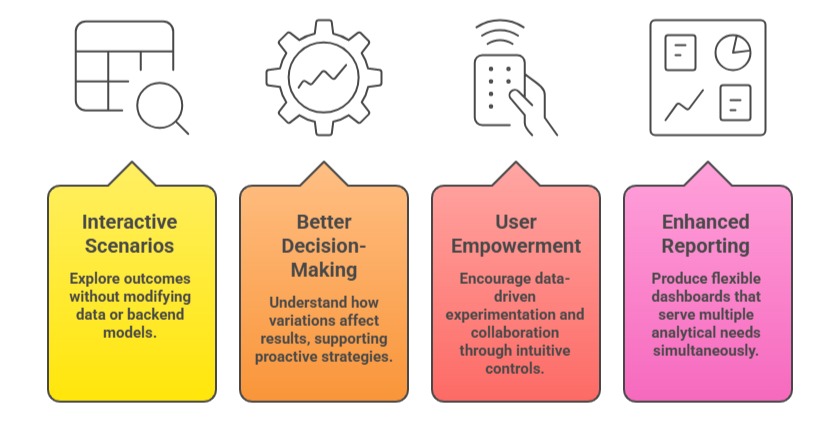
Benefits of Using Dynamic Calculations and What-If Analysis

Class Sessions
Sales Campaign

We have a sales campaign on our promoted courses and products. You can purchase 1 products at a discounted price up to 15% discount.