Power BI is a powerful business intelligence platform that offers multiple interfaces to meet the diverse needs of users across data analytics, report development, sharing, and consumption.
Three primary components of this platform are Power BI Desktop, Power BI Service, and Power BI Mobile App.
Each serves a distinct purpose within the BI lifecycle and caters to different roles, from data analysts who create reports to business users who consume insights on the go.
Understanding these components and their unique functionalities is essential for leveraging Power BI effectively in modern data-driven organizations.
Power BI Desktop is the authoring tool, designed primarily for data analysts and BI developers.
It provides a rich environment to connect to various data sources, perform data transformation and cleansing with Power Query, create sophisticated data models, and design interactive reports using an extensive library of visualizations.
It supports advanced calculations through Data Analysis Expressions (DAX) and allows data modeling with relationships and hierarchies.
Reports developed in Power BI Desktop can be saved locally, shared as files, or published to the Power BI Service for collaboration and distribution.
Power BI Desktop Features
Power BI Desktop provides a comprehensive set of tools for data integration, modeling, and visualization. The following list outlines its most important features that support interactive analytics and reporting.
1. Connects to a wide array of data sources: databases, cloud services, spreadsheets, APIs.
2. Provides Power Query for ETL (Extract, Transform, Load) operations in a visual and coded interface.
3. Enables creating relationships among data tables and building hierarchical data models.
4. Supports creating calculated columns/measures with DAX for complex business logic.
5. Offers drag-and-drop report canvas to build interactive visuals and dashboards.
6. Allows report preview locally and the ability to publish directly to Power BI Service.
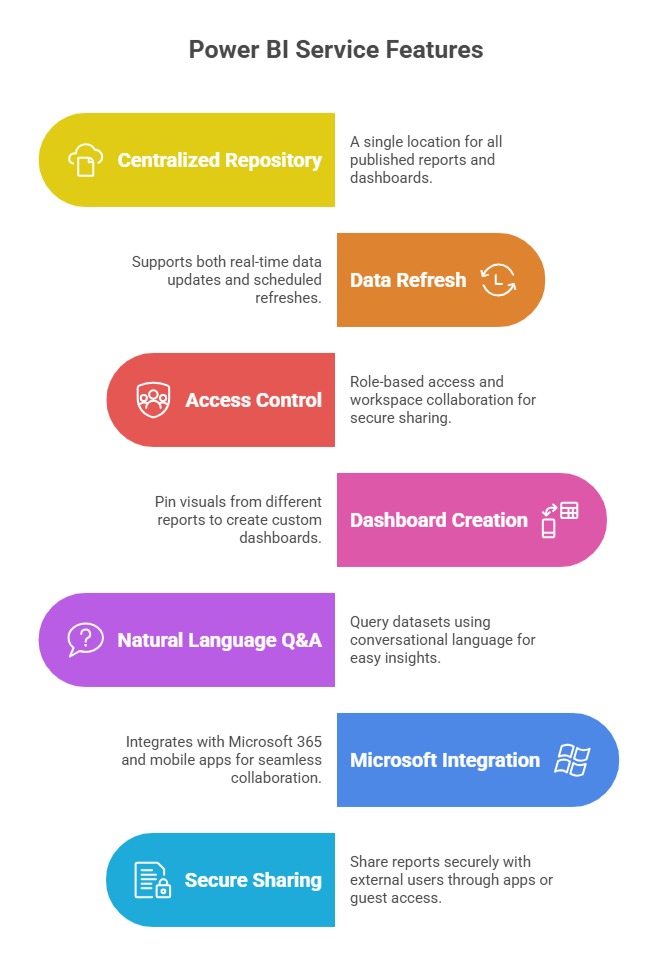
Power BI Service (Power BI Online)
Power BI Service is a cloud-based platform that enables users to publish, share, and collaborate on Power BI reports and dashboards securely.
It transforms authored reports into interactive dashboards accessible via web browsers, providing real-time data refresh and collaborative features.
The service supports workspace management where teams can co-create content, assign access roles, and manage security.
It also facilitates scheduling data refresh, alerting on key metrics, embedding reports in other apps, and integrating with Microsoft 365 tools like Teams and SharePoint.
The Power BI Service is designed for business users, decision-makers, and analysts who need timely access to insights and want to collaborate across departments.
Unlike Desktop, it emphasizes consumption, distribution, and monitoring of BI content rather than report creation.
Power BI Mobile App
To empower business users with access to insights anytime and anywhere, Microsoft offers the Power BI Mobile App, which is available on Android and iOS devices.
This mobile client provides an optimized interface for viewing reports and dashboards on smaller screens and supports interactive data exploration through touch gestures.
The app also supports push notifications, data-driven alerts, and offline report viewing. Mobile users can comment on reports and participate in collaborative discussions directly from their devices.
The mobile app is essential for executives, field teams, and on-the-move professionals who rely on up-to-date data to make decisions without waiting for desktop or web access.
Power BI Mobile App Highlights:
1. On-the-go access to reports and dashboards from smartphones and tablets.
2. Interactive data exploration with zoom, filter, and drill-down capabilities.
3. Push notifications and alerts on critical business changes.
4. Supports offline access to reports for areas with limited connectivity.
5. Collaborative features including report comments and discussions.
