Context in DAX is a fundamental concept that governs how expressions are evaluated in Power BI and other Analysis Services environments.
Understanding context is key to mastering DAX because it controls the behavior of formulas and calculations based on their environment, allowing for dynamic and flexible data analysis.
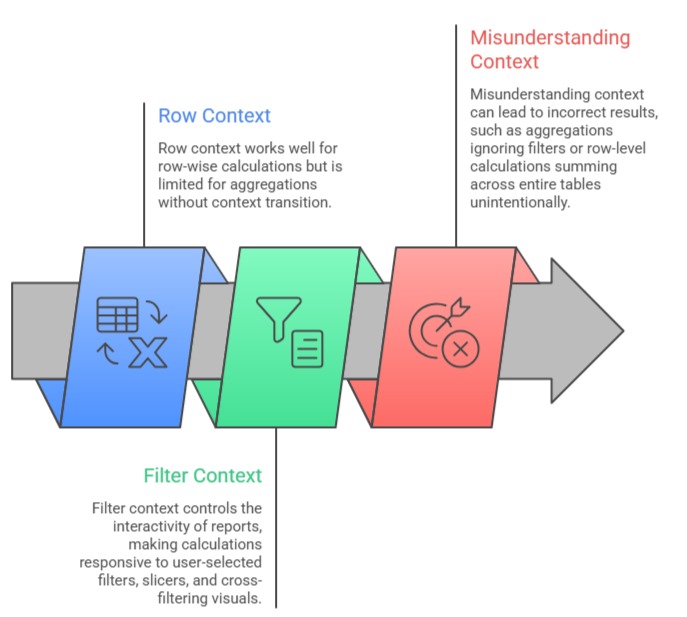
The two main types of context in DAX are row context and filter context, and each plays a unique role in defining what data is accessible and how calculations are performed.
Row context refers to the current row in a table during a calculation, typical in calculated columns and iterators, where DAX performs evaluations on a row-by-row basis.
Filter context, on the other hand, is the set of filters applied to data, often driven by slicers, report filters, or relationships, that restrict the data scope for aggregations in measures.
The interaction between these contexts can be nuanced, especially when transitioning context through functions like CALCULATE or when nested iterators are used.
This interplay is central to writing effective DAX that adapts dynamically to reporting scenarios and user inputs.
Row Context
Row context exists when a DAX expression is evaluated for each row in a table individually. It acts like a cursor moving through rows, enabling calculations involving the row’s column values.
Usage: Typically present in calculated columns, variables within iterators like SUMX, FILTER, or ADDCOLUMNS.
How it works: When a formula references a column, it retrieves the value from the current row being processed.
Example:
Profit = Sales[Revenue] - Sales[Cost] Each row’s profit is calculated individually using row context.
Filter Context
Filter context is the subset of data defined by filters applied in reports, slicers, or by relationships during measure evaluation. It dictates what data is included or excluded during calculation.
Usage: Primarily relevant for measures and aggregations where data is summed, averaged, or counted under certain constraints.
How it works: Filtering data affects what rows are considered for aggregate functions; multiple filters combine logically to restrict the dataset.
Example:
A measure calculating total sales for a specific region considering filters from the report page:
Total Sales = SUM(Sales[Revenue])The actual rows summed depend on the current filter context from slicers or report filters.
Context Transition
When functions like CALCULATE() are used within row context, Power BI transforms row-level information into filters applied at the aggregation level.
Importance: Enables complex dynamic calculations such as context-sensitive aggregations or conditional sums.
Example:
Total Sales for current Product = CALCULATE(SUM(Sales[Revenue]), Products[ProductID])Here, the row context of a product transitions to filter context to calculate total sales for that specific product.
Interaction and Practical Implications

Class Sessions
Sales Campaign

We have a sales campaign on our promoted courses and products. You can purchase 1 products at a discounted price up to 15% discount.