USD ($)
$
United States Dollar
Euro Member Countries
India Rupee

Star Schema and Snowflake Schema Concepts

Lesson 11/44 | Study Time: 20 Min

Star Schema and Snowflake Schema are two foundational data modeling techniques widely used in data warehousing and business intelligence systems.

Both designs aim to organize data in ways that facilitate efficient querying and reporting by structuring data into fact and dimension tables.

However, they differ significantly in their level of normalization, complexity, storage efficiency, and query performance.

Star Schema 

It is a straightforward and intuitive design where a central fact table connects directly to multiple denormalized dimension tables.

This flat structure simplifies querying by minimizing the number of join operations necessary, which accelerates report generation and ad hoc data exploration.

The simplicity of the star schema makes it easy to understand and implement but it stores redundant data within the dimension tables, leading to potentially higher storage requirements.


Star Schema Characteristics


1. Central fact table containing measurable business metrics (e.g., sales, revenue, transactions).

2. Surrounding denormalized dimension tables with descriptive attributes (e.g., product, customer, time).

3. Simpler structure with fewer tables and joins, improving query speed.

4. Higher data redundancy due to denormalization of dimensions.

5. Preferred for fast querying, straightforward reporting, and smaller to medium data volumes.

6. Easier for business users to understand and navigate.

Snowflake Schema 

It normalizes dimension tables into multiple related sub-tables, resembling a snowflake shape. This approach reduces data redundancy by decomposing data into finer granularity and establishing foreign key relationships among the normalized tables.

While this results in more complex queries involving additional joins, it offers better data integrity, reduced storage space, and is well-suited for handling detailed hierarchies and complex dimensions.


Snowflake Schema Characteristics


1. Central fact table connected to normalized dimension tables split into multiple related sub-dimensions.

2. Dimension tables are decomposed to avoid redundancy and improve data consistency.

3. More complex schema requiring more joins, leading to slower query performance.

4. Reduced storage footprint due to normalization.

5. Suitable for large, complex datasets with hierarchical or multi-level dimensions.

6. Better data integrity and easier maintenance of dimension data updates.

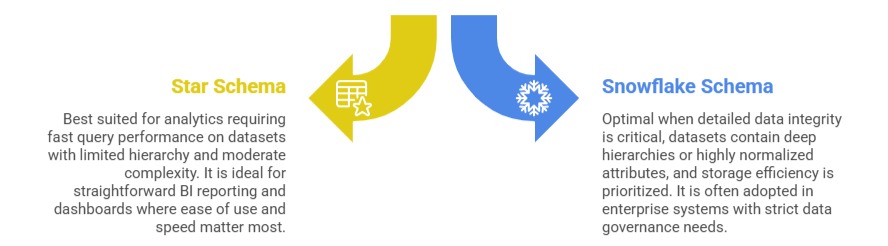
When to Use Which Schema

Star Schema: Best suited for analytics requiring fast query performance on datasets with limited hierarchy and moderate complexity. It is ideal for straightforward BI reporting and dashboards where ease of use and speed matter most.

Snowflake Schema: Optimal when detailed data integrity is critical, datasets contain deep hierarchies or highly normalized attributes, and storage efficiency is prioritized. It is often adopted in enterprise systems with strict data governance needs.

Ryan Cole

Ryan Cole

Product Designer
Profile

Class Sessions

1- Overview of Business Intelligence Concepts 2- Power BI Ecosystem and Components 3- Understanding Power BI Desktop, Service, and Mobile App 4- Data-Driven Decision Making Fundamentals 5- Connecting to Data Sources (SQL, Excel, Cloud, APIs) 6- Data Import vs Direct Query 7- Power Query Editor Basics and Advanced Transformations 8- Data Cleaning, Shaping, and Formatting 9- Creating Query Parameters and Templates 10- Principles of Data Modeling in Power BI 11- Star Schema and Snowflake Schema Concepts 12- Creating and Managing Relationships Between Tables 13- Calculated Columns vs Measures 14- Role of Lookup and Fact Tables in BI 15- DAX Fundamentals and Syntax 16- Calculated Columns and Measures in Depth 17- Aggregation and Filter Functions 18- Time Intelligence Calculations (YTD, MTD, QTD, etc.) 19- Context in DAX: Row Context and Filter Context 20- Using Variables and Advanced Calculation Techniques 21- Dynamic Calculations and What-If Analysis 22- Hierarchies and Drill-Down Techniques 23- Working with Parent-Child and Many-to-Many Relationships 24- Optimizing DAX for Performance 25- Principles of Effective Data Visualization 26- Creating Interactive Reports and Dashboards 27- Choosing the Right Visuals (Charts, KPIs, Maps, Tables) 28- Using Bookmarks, Tooltips, and Drillthroughs 29- Applying Conditional Formatting and Visual Level Filters 30- Publishing Reports to Power BI Service 31- Workspaces and Apps in Power BI 32- Sharing and Collaborating Securely with Row-Level Security (RLS) 33- Scheduled Refresh and Data Gateway Configuration 34- Usage Metrics and Report Usage Monitoring 35- Real-Time Data Streaming and Dashboards 36- Integration with Azure Synapse and Cognitive Services 37- AI Features in Power BI: Insights, Q&A, and Anomaly Detection 38- Using Power Automate with Power BI for Workflow Automation 39- Implementing Predictive Analytics and Forecasting 40- Best Practices for Data Model Optimization 41- Query Reduction and Load Optimization Techniques 42- Troubleshooting Common Power BI Issues 43- Monitoring Performance with Performance Analyzer 44- Governance and Compliance Considerations in Power BI