Implementing predictive analytics and forecasting in Power BI transforms raw data into forward-looking insights, enabling organizations to make proactive decisions based on future scenarios.
These advanced analytical techniques go beyond descriptive reporting by applying statistical models, machine learning algorithms, and time series analysis to project future trends, customer behaviors, or operational outcomes.
Integrating predictive capabilities within Power BI empowers decision-makers to anticipate risks, seize opportunities, and allocate resources more effectively, fostering a strategic advantage in dynamic business environments.
Power BI supports a variety of methods for implementing predictive analytics and forecasting, ranging from built-in features to integration with Azure Machine Learning and R/Python scripts.
These tools allow users to create models that predict sales, forecast demand, estimate churn, or identify potential failures.
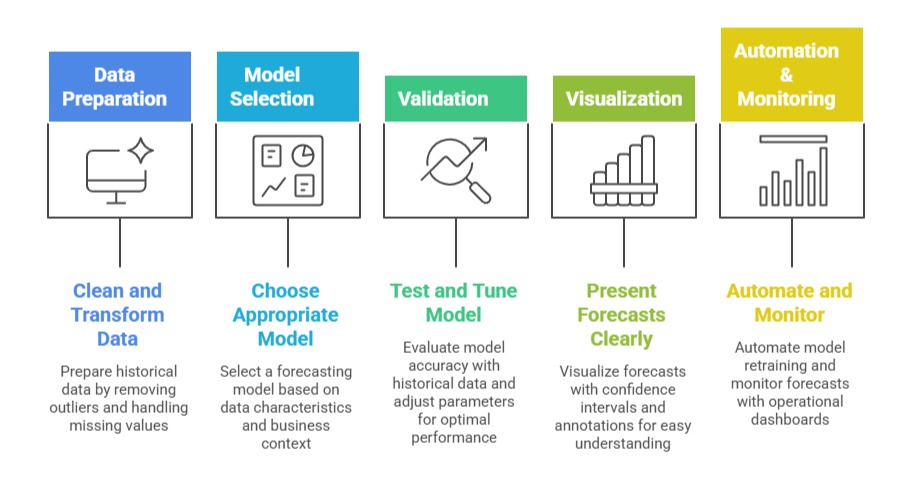
Proper implementation involves preparing data, selecting the right modeling techniques, validating accuracy, and embedding forecasts seamlessly within interactive reports for ongoing monitoring and decision support.
Core Techniques for Predictive Analytics in Power BI
Predictive analytics in Power BI can be implemented at different levels of complexity. The following techniques demonstrate how users can move from basic forecasting to advanced AI-driven predictions.
1. Time Series Forecasting with Built-in Visuals
Power BI offers native forecasting features within line charts and Azure-powered visuals.
Enable forecasting options directly in the visual's analytics pane.
Set parameters such as forecast length, confidence intervals, seasonality, and accuracy metrics.
Use historical data points to generate future predictions, visualize confidence bands, and assess reliability.
2. Using DAX for Basic Predictions
Develop simple linear or moving average forecasts through custom measures.
Examples: Running total or moving average calculations and Period-over-period growth projections.
Suitable for quick, high-level forecasts with limited complexity.
3. Integration with Azure Machine Learning
Create and train predictive models in Azure ML or other platforms.
Use Power BI’s Azure Machine Learning connector to incorporate real-time scoring and predictions.
Embed results in dashboards and reports for operational decision-making.
Supports models such as classification, regression, and clustering.
4. Embedding R and Python Scripts
Utilize R or Python scripts in Power BI Desktop for advanced modeling.
Apply statistical techniques, custom algorithms, or open-source libraries.
Refresh models regularly, incorporate new data, and visualize predictions directly.
Best Practices for Effective Forecasting
Accurate forecasting depends on both strong data foundations and well-chosen analytical techniques. The key best practices below outline how to build reliable, interpretable, and actionable forecasts.
Use Cases of Predictive Analytics in Power BI


Class Sessions
Sales Campaign

We have a sales campaign on our promoted courses and products. You can purchase 1 products at a discounted price up to 15% discount.