In deep learning, building a model is only the first step; understanding its performance is equally crucial.
Model evaluation metrics provide quantitative measures to assess how well a model predicts outcomes on unseen data, allowing practitioners to gauge accuracy, robustness, and generalization.
Choosing the right metrics depends on the type of task—classification, regression, ranking, or generation—and ensures that models are aligned with business or scientific objectives.
For example, accuracy might suffice for balanced classification tasks, while precision, recall, and F1-score are more meaningful in imbalanced datasets, such as fraud detection or rare disease prediction.
Error analysis complements evaluation metrics by qualitatively examining where models fail.
By identifying patterns in mispredictions, such as specific classes, feature combinations, or input conditions, practitioners can make informed decisions about model improvements.
This may involve refining data, adjusting model architecture, tuning hyperparameters, or incorporating additional features.
In computer vision, for instance, error analysis may reveal that a model struggles with occluded objects, prompting targeted augmentation or architectural adjustments.
Deep learning models often operate as “black boxes,” making it essential to pair quantitative metrics with in-depth error analysis to ensure transparency, fairness, and reliability.
Metrics like confusion matrices, ROC-AUC, mean squared error, BLEU score, or log-likelihood provide numerical insight, while visualizations and case-by-case inspection highlight nuanced failure modes.
Choosing the Right Metrics for Model Assessment
Choosing appropriate evaluation metrics is essential for accurately measuring a model’s performance and guiding improvements.
The right metrics ensure that optimization aligns with the specific goals, risks, and characteristics of the problem being solved.
1. Accuracy and Error Rate
Accuracy measures the proportion of correct predictions out of total predictions.
While simple and intuitive, it can be misleading for imbalanced datasets where one class dominates.
Error rate, which is the complement of accuracy, provides an overall failure measure.
Both metrics give a high-level overview but should be supplemented with class-specific or probabilistic metrics in complex scenarios to capture performance nuances.
2. Precision, Recall, and F1-Score
Precision quantifies the proportion of true positive predictions among all positive predictions, indicating the model’s reliability when predicting positive cases.
Recall measures the proportion of true positives detected out of all actual positives, reflecting sensitivity.
F1-score combines both precision and recall into a harmonic mean. These metrics are critical in tasks like medical diagnosis or fraud detection, where false positives or false negatives have different costs and implications.
3. Confusion Matrix Analysis
A confusion matrix provides a detailed breakdown of true positives, false positives, true negatives, and false negatives.
By visualizing misclassifications, practitioners can identify specific patterns or classes where the model underperforms.
This level of granularity enables targeted interventions, such as class-specific data augmentation, reweighting, or model architecture adjustments to improve weak areas.
4. ROC Curve and AUC
The Receiver Operating Characteristic (ROC) curve plots true positive rate against false positive rate at various thresholds.
The Area Under the Curve (AUC) provides a single-number summary of model discrimination.
These metrics are particularly useful for binary classification tasks, allowing threshold tuning based on trade-offs between sensitivity and specificity, which is vital in applications like medical screening or spam detection.
5. Regression Metrics
For regression tasks, metrics such as Mean Squared Error (MSE), Mean Absolute Error (MAE), Root Mean Squared Error (RMSE), and R-squared quantify prediction deviations from actual values.
These metrics capture both magnitude and variability of errors, helping identify underfitting, overfitting, or heteroscedasticity in the model’s predictions.
Error patterns may indicate the need for feature engineering or model complexity adjustments.
6. Error Analysis and Visualization
Beyond numeric metrics, detailed error analysis involves examining mispredictions across features, classes, or input conditions.
Techniques like saliency maps, feature importance plots, and case-specific inspections allow practitioners to understand why the model fails in certain situations.
This step is crucial for improving model robustness and ensuring that high-stakes predictions, such as autonomous driving or financial forecasts, are reliable.
7. Task-Specific Metrics
Depending on the application, specialized metrics provide more relevant evaluation.
Examples include BLEU score for machine translation, IoU for segmentation tasks, and log-likelihood for probabilistic models.
Choosing the right metric ensures that model improvements align with the intended task objectives and do not over-optimize for an irrelevant measure.
Challenges
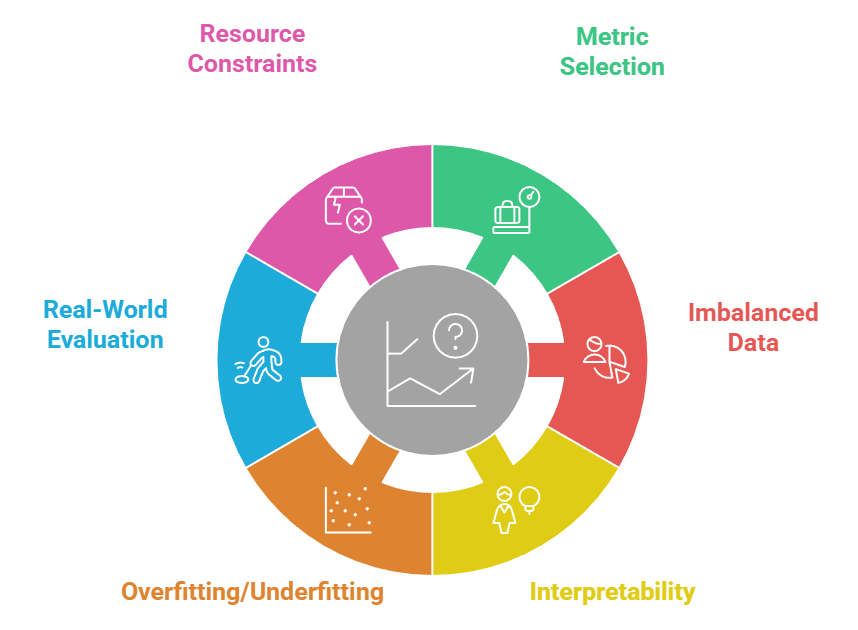
1. Metric Selection for Complex Tasks
Choosing the right evaluation metric can be challenging, especially in multi-class, multi-label, or imbalanced datasets.
Relying solely on accuracy may hide poor performance in minority classes, while specialized metrics like F1-score or ROC-AUC may require careful interpretation.
Misalignment between task objectives and selected metrics can lead to models that optimize numbers but fail in real-world applications.
2. Handling Imbalanced Data
Imbalanced datasets make evaluation difficult, as models can achieve high overall accuracy while failing to identify minority class instances.
Metrics like recall, precision, or class-weighted loss functions help, but designing an evaluation strategy that fairly captures model performance remains complex.
Additionally, rare events are often high-stakes, requiring rigorous validation.
3. Interpretability of Metrics
Numerical metrics provide quantitative insight but often lack interpretability.
Understanding why a model performs poorly on certain inputs or classes requires detailed error analysis and visualization.
Without interpretability, stakeholders may not trust the model’s predictions, especially in critical domains like healthcare, finance, or autonomous systems.
4. Overfitting and Underfitting Detection
Metrics alone may not reveal overfitting or underfitting, especially if validation sets are small or not representative.
Error analysis is necessary to detect patterns such as consistent misclassification of specific classes or features.
Identifying these issues requires careful design of evaluation sets and repeated cross-validation to ensure generalization.
5. Evaluation in Real-World Scenarios
Metrics calculated on test sets may not fully reflect performance in production environments, where data distributions can shift over time.
Models may encounter noisy, incomplete, or out-of-distribution inputs, which can significantly degrade performance.
Continuous monitoring and retraining strategies are essential to address real-world challenges.
6. Computational and Resource Constraints
Evaluating deep learning models on large datasets, high-resolution images, or sequential data can be resource-intensive.
Computing metrics like AUC or confusion matrices for millions of samples requires significant memory and processing power, making efficient evaluation pipelines crucial for practical deployment.
Real-Life Case Studies
Real-world applications demonstrate how selecting appropriate metrics and performing thorough error analysis directly influence model effectiveness.
These case studies show how evaluation strategies guide practical improvements across high-impact domains.
1. Healthcare: Disease Diagnosis Models
Hospitals and research institutions deploying deep learning models for medical imaging, such as detecting tumors in X-rays or MRIs, rely heavily on metrics like precision, recall, and F1-score to ensure that rare conditions are not missed.
Error analysis often reveals that misclassifications occur in low-contrast images or unusual anatomical variations.
By examining mispredictions, radiologists and data scientists adjust preprocessing steps, augmentation strategies, or model architectures to improve reliability, ultimately enhancing patient safety.
2. Finance: Fraud Detection
In banking, fraud detection models face highly imbalanced data, as fraudulent transactions are rare compared to legitimate ones.
Metrics such as ROC-AUC, precision at top-k, and recall are used to measure performance.
Detailed error analysis identifies patterns like false positives in specific transaction types, enabling targeted model improvements.
This iterative evaluation process is critical to minimizing financial loss and maintaining customer trust.
3. Autonomous Vehicles
Self-driving car companies use deep learning models for object detection, lane detection, and obstacle avoidance.
Metrics like IoU, mean Average Precision (mAP), and false positive/negative rates are crucial for evaluating safety.
Error analysis uncovers failure cases under adverse weather, occlusions, or unusual road layouts. Insights from these analyses guide improvements in sensor fusion, model architecture, and training data augmentation to enhance real-world performance.
4. NLP: Machine Translation
Companies like Google and DeepL evaluate translation models using BLEU scores, METEOR, and human evaluation.
Error analysis reveals where models produce incorrect grammar, mistranslations, or contextually inappropriate words.
By examining these errors, engineers refine tokenization, adjust training corpora, and improve contextual embeddings, leading to more accurate and fluent translations for users globally.