In data analysis and machine learning, dealing with missing values and outliers is crucial for building accurate and reliable models. Missing data can arise due to errors in data collection, transmission issues, or non-response, while outliers represent anomalous or extreme values that deviate significantly from the majority of data. Proper handling of these issues ensures the integrity of data, prevents biased models, and improves prediction performance.
Handling Missing Values
Missing values refer to the absence of data points for certain variables of interest. Ignoring missing data or handling it improperly can lead to reduced statistical power, biased estimates, and incorrect conclusions. It is essential first to understand the pattern and mechanism behind missingness, such as: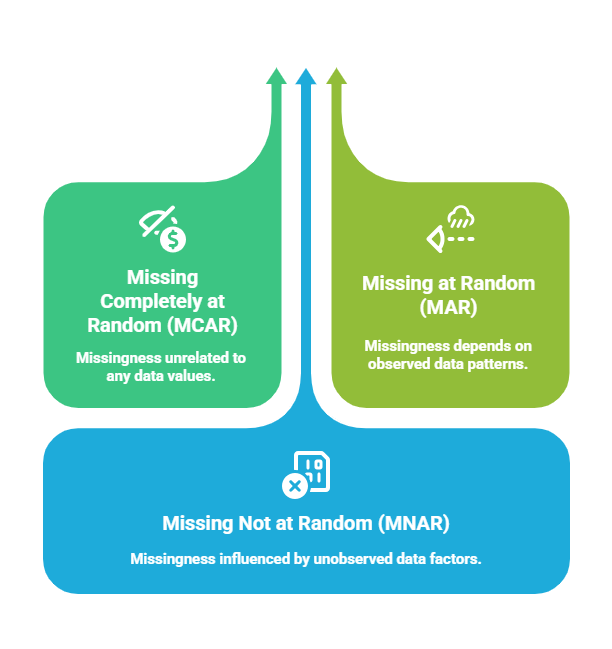
Methods for Handling Missing Values
To produce accurate and unbiased results, analysts must apply effective strategies for dealing with missing information. The following methods outline how datasets can be cleaned and made analysis-ready.
1. Deleting Missing Data
Rows or columns with missing values are removed (Listwise deletion).
Suitable when the missing portion is small and removing it does not bias the dataset.
Risks of losing significant information if missingness is widespread.
2. Imputation Techniques
Replacing missing values with estimated or plausible values.
Simple imputation: Mean, median, or mode replacement for numerical/categorical data.
Advanced imputation: k-Nearest Neighbors (KNN), regression imputation, or Multiple Imputation by Chained Equations (MICE).
Imputation retains the dataset size and structure and reduces bias from missingness.
4. Forward/Backward Fill: Common in time-series data, filling missing values with the previous or next valid observation.
5. Using Predictive Models: Machine learning models can predict missing values based on other features.
Outlier Detection and Treatment
Outliers are data points that differ significantly from other observations. They can result from measurement errors, data entry errors, or genuine variability. Identifying and treating outliers prevents distortion of statistical analyses and model biases.
Methods for Detecting Outliers
To ensure reliable analysis, it’s crucial to recognize observations that fall far from expected behavior. The following approaches outline both statistical and algorithmic techniques for detecting outliers.
1. Statistical Methods
Z-score: Measures how many standard deviations a point is from the mean. A common threshold is |Z| > 3.
Interquartile Range (IQR): Data points outside 1.5×IQR above the third quartile or below the first quartile are considered outliers.
2. Visualization Techniques: Box plots, scatter plots, and histograms help visually identify anomalous points.
3. Model-Based Approaches: Isolation Forest, DBSCAN, and Local Outlier Factor algorithms identify outliers in complex data.
Outlier Treatment Strategies
To maintain accurate patterns in the dataset, outliers must be treated with methods suited to their cause and relevance. Below is an overview of popular techniques used to soften, adjust, or isolate extreme values..png)

Class Sessions
Sales Campaign

We have a sales campaign on our promoted courses and products. You can purchase 1 products at a discounted price up to 15% discount.